Worksheets
Homework #2
Total questions: 20
Worksheet time: 2hrs 40mins

During which segment did the car come to a complete stop?
Segment A to B
Segment B to C
Segment C to D
Segment D to E
During which segment did the car travel back toward its starting position?
Segment A to B
Segment B to C
Segment C to D
Segment D to E
During which segment did the car travel the fastest?
Segment A to B
Segment B to C
Segment C to D
Segment D to E
What distance had the car traveled at 10 hours?
60km
50km
60
50
The two variables used in the graph are:
speed and time
distance and time
going fast and slowing down
Estimate how many hours passed when the trip was at 100km
About 5 hours
About 16-17 hours
about 25 hours
Which graph shows no speed

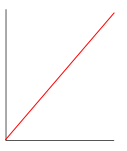
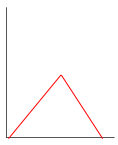
Which graph constant speed
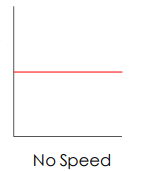
Which graph shows a change in velocity

Which runner accelerated the fastest at the start of the race?
Runner A
Runner B
Runner C
Which runner ran at a constant speed
Runner A
Runner B
Runner C
Which runner won the race?
Runner A
Runner B
Runner C
Which runner had a bad start to his race?
Runner A
Runner B
Runner C
What was runner A's speed at 15 sec?
150
10
10 m/s
150 m/s
What was runner C's speed between 5 sec and 15 sec?
15 m/s
10 m/s
5m/s
0 m/s

Choose the description that best describes this motion graph.
The object is accelerating at an increasing rate.
The object is moving at a constant velocity/speed.
The object moved at a constant speed, then stopped. After stopping, it returned to the beginning and then moved back in the original direction at a very fast constant speed.

Choose the description that best describes this motion graph.
The object is accelerating at an increasing rate.
The object is moving at a constant velocity/speed.
The object moved at a constant speed, then stopped. After stopping, it returned to the beginning and then moved back in the original direction at a very fast constant speed.

During which segment is the object decreasing speed?
X
Y
Z
During which segment is the object increasing speed?
X
Y
Z