
NEW
Font size
S
M
L
XL
 Worksheets
Quiz Motion Graphs
Total questions: 20
Worksheet time: 5hrs 0mins
Name
Class
Date
1.

What is happening at D?
a)
Stationary
b)
Accelerating
c)
Fast steady speed; moving away from the starting position
d)
Slower steady speed; moving away from the starting position
2.

What is happening at E?
a)
Stationary
b)
Accelerating
c)
Fast steady speed; moving away from the starting position
d)
Steady speed; returning to start position
3.

What is happening at A?
a)
Stationary
b)
Accelerating
c)
Slower steady speed; moving away from the starting position
d)
Steady speed; returning to start position
4.

What is happening at B?
a)
Stationary
b)
Accelerating
c)
Slower steady speed; moving away from the starting position
d)
Steady speed; returning to start position
5.

Which runner won the race?
a)
A
b)
B
c)
C
6.

Which runner had a head start?
a)
A
b)
B
c)
C
7.

At what time did runner A pass runner B?
a)
0 seconds
b)
1 second
c)
2 seconds
d)
3 seconds
8.

During the second segment, which is between 50 seconds and 70 seconds, which direction is Tom moving?
a)
Tom was moving back towards his house
b)
Tom was moving down a hill
c)
Tom was moving towards the bus stop
d)
Tom was not moving
9.

Which runner stopped for a rest?
a)
Albert
b)
Bob
c)
Charlie
10.

How many times does this object STOP moving?
a)
None
b)
Once
c)
Twice
d)
Three times
11.

At 60 seconds, how far had this object traveled?
a)
0 m
b)
10 m
c)
20 m
d)
40 m
12.

Which graph shows the object standing still?
a)
A
b)
B
c)
C
d)
D
13.
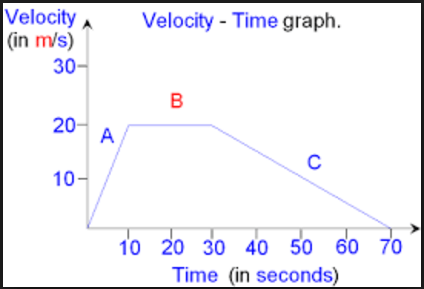
This is a velocity-time graph. What is the object doing in segment C?
a)
Positive acceleration
b)
Negative acceleration
c)
Constant Velocity
d)
Not moving
14.
What is velocity?
a)
the quickness of an object
b)
the location of an object
c)
acceleration
d)
speed in a specific direction
15.
Total distance divided by total time is
a)
average speed
b)
constant speed
c)
instantaneous speed
d)
acceleration
16.
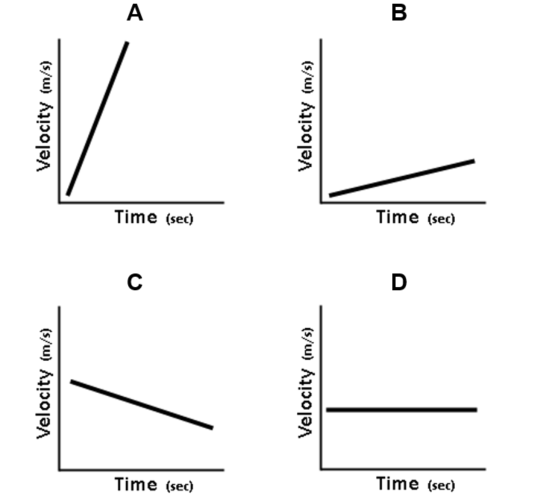
Which graph represents zero acceleration (constant velocity)?
a)
A
b)
B
c)
C
d)
D
17.
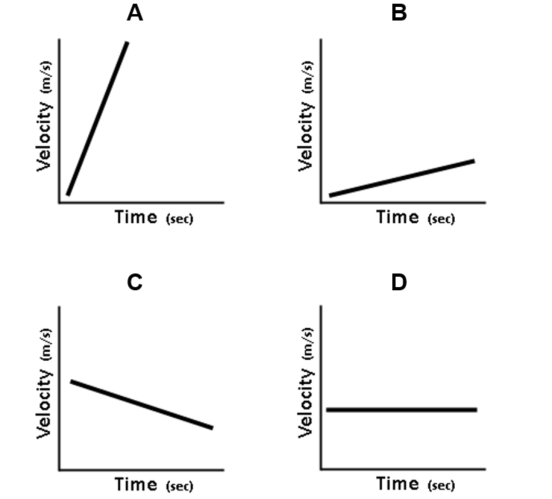
Which graph represents the greatest acceleration?
a)
A
b)
B
c)
C
d)
D
18.

What is this graph showing?
a)
Constant Speed
b)
Acceleration (speeding up)
c)
Deceleration (slowing down)
d)
No motion
19.
Speed =
a)
distance / time
b)
time / distance
c)
distance * time
20.

Which line represents an object moving at a slower speed?
a)
A
b)
B
Reset

