NEW
Font size
 Worksheets
BSCS 4-3 - Elective 3 - Final Exam - 2-3-2024
Total questions: 45
Worksheet time: 23mins
A branch of statistics focused on summarizing and describing the characteristics of a dataset
Measure of center
Measure of position
Measure of dispersion
Descriptive Statistics
Defined as to the entire pool of data from which of your interest for some question or experiment. Basic examples for this are the entire group of people, objects, measurements, etc., a group of phenomena that have something in common
Population
Sample
Statistics
Parameter
In data science and statistics field, this refers as something that we are telling a whole story in a few words.
Predicting
Describing
Summarizing
Expressing
Statistics helps us to make intelligent decisions in the presence of variability and ________?
Analysis
Variation
Uncertainty
Facts
A form of mathematical analysis that uses quantified models and representations for a given set of experimental data or real-life studies.
Population
Sample
Statistics
Parameter
When we say quantitative characteristics, these are the numbers that summarizes data for an entire population that you are interested in?
Population
Sample
Statistics
Parameter
A smaller group of members of a population selected to represent the population. Or, it is just a random selection of members of a population
Population
Sample
Statistics
Parameter
Which of the following is the correct formula for the mean with frequencies?
Σxf/n
Σx/fn
Σxn/f
Σxf/x
This part of statistics where it provides insights into the extent to which data points deviate from the center value, which reveals how much the values differ from each other.
Measure of center
Measure of position
Measure of dispersion
Descriptive Statistics
The measures of central tendency has three (3) descriptions: (1) mean, (2) median, and (3) mode. Which of the following under measures of center has no built-in function in R?
mean
median
mode
a and c
Which of the following statement is correct about why we need measures of spread?
To have a clear idea about the distribution of the data by telling the variation of the data from one another.
It gives us an idea of how well the mean represents the data
Provides simple summaries about the sample and the measures, together with simple graphics analysis, they form the basis of virtually every quantitative analysis of data
a and b
Which of the following statement is best describe the use of simple Mean value?
Income of the middle-class employees
Average income of Computer Scientist
Frequent number of Potatoes
None of the mentioned
This attempt to measure the average distance from the mean. How spread out is the data considering all the data values on average, and how far are they from the mean.
Probability
Standard Deviation
Normal Distribution
Using Box and Whiskers Plot
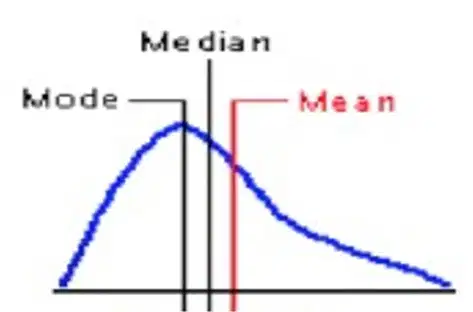
When the distribution is like the image given (see the given image), what does it represent?
Positive Skewed
Negative Skewed
Normal Skewed
Symmetric Distributed
From the given dataset, our data has the following characteristics: (1) the mass of the distribution is concentrated on the right, (2) left tail is longer, (3) mean is less than median, (4) and median is less than the mode. What does it represent?
Positive Skewed
Negative Skewed
Normal Skewed
Symmetric Distributed
Which of the following measurements can still be used for measuring dispersion?
Minimum
Maximum
Range
All of the mentioned
A measure of statistical dispersion which defined as the range between the first quartile (Q1) and the third quartile (Q3) in a dataset.
Range
Segments
Interquartile
quantile
What is the kurtosis of a normal distribution?
0
1
2
3
What is the correct formula for calculating the Interquartile Range (IQR) in statistics?
IQR = Q3 − Q1
IQR = 2/Q3−Q1
IQR = Q1+Q3/2
IQR = Q3 + Q1
In a dataset, the distribution of values is analyzed, and it is found that the peak of the distribution is higher and the tails are fatter than a normal distribution. What type of kurtosis does this distribution exhibit?
Mesokurtic
Leptokurtic
Platykurtic
Symmetrikurtic
A positive values of kurtosis indicate that distribution is peaked and possesses thick tails. This represents as _______.
Mesokurtic
Leptokurtic
Platykurtic
Symmetrikurtic
To use the skewness and kurtosis in R, which of the following packages is we need to install?
moments
dplyr
tidyverse
stat
You have a dataset named "scores" with columns "Math" and "English." You want to obtain an overall statistical measure for both columns. Which R function will you use for this purpose?
stats()
analyze()
describe()
summary()

The following data concerns the blood haemoglobin (Hb) levels and packed cell volumes (PCV) of 14 female blood bank donors. It is of interest to know if there is a relationship between the two variables Hb and PCV when considered in the female population. What is the most suitable statistical graph in R to visualize the relationship between the mentioned pair of variables?
Histogram
Scatter plot
Box and Whiskers
Box Plot
Suppose you are analyzing the relationship between the number of hours students spend studying for a test and their scores. After calculating the correlation coefficient in R, you find it to be approximately 0.04. What can be concluded from this correlation value?
Strong Positive Correlation
Weak Positive Correlation
No Correlation
Weak Negative Correlation
You are tasked with creating a visually appealing and informative scatter plot to explore the relationship between the heights and weights of individuals in a dataset. Which R package provides an excellent solution for creating customizable and publication-quality plots?
base R plotting
lattice package
ggplot2 package
plotly package
In a study examining the relationship between the number of hours individuals engage in physical exercise per week and their cardiovascular fitness levels, researchers collect data and observe a trend. When the data is plotted on a scatter plot, it shows an upward-sloping pattern. What term best describes the observed relationship?
Positive Correlation
Negative Correlation
No Correlation
Perfect Correlation
In a study conducted to analyze the distribution of ages among participants in a fitness program, researchers collect age data from a sample. They want to create a graphical representation that provides insights into the age distribution. Which statistical graph is most suitable for visualizing the age distribution in this scenario?
Scatter Plot
Line Chart
Histogram
Boxplot
A data science team is working on a project that involves analyzing large datasets stored in a relational database system. They need to establish a seamless connection between R and the database to efficiently retrieve and analyze the data. Which of the following R packages plays a crucial role in facilitating this communication?
Database Interface
RMySQL
dplyr
RSQL
In a data science project, you are tasked with establishing a connection between your R session and a SQL database to retrieve and manipulate data. Which R function is specifically designed for creating this database communication that needs?
dbRead()
dbConnect()
connectDB()
dbConnection()
What function in R allows you to execute SQL queries?
sql_query()
dbGetQuery()
sqlExecute()
querySQL()
What is the correct syntax for calling a function in R?
function_name(argument1, argument2)
function_name[argument1, argument2]
function_name{argument1, argument2}
function_name<argument1, argument2>
Which of the following is an example of a function call with a named argument in R?
function_name(argument2 = value2, argument1 = value1)
function_name(argument1 = value1, value2)
function_name(argument1, argument2)
function_name(value1, value2)
We use this measurement to assess how far a distribution is from a normal distribution, specifically indicating the direction whether the frequency distribution is in a symmetric or asymmetric.
Standard Deviation
Kurtosis
Skewness
Z-Scores
A data analyst is working with a dataset that contains the number of hours per week that a group of employee’s work. Which of the following measures of central tendency is most appropriate to use in this scenario?
Mode
Median
Range
Mean
Which function in R is used to create a boxplot using the ggplot2 package?
geom-plot()
geom-boxplot()
geom_plot()
geom_boxplot()
In a statistical analysis project, you are comparing the distribution of exam scores among students from two different classes. You want to visualize the central tendency, spread, and potential outliers in each class's exam scores. Which type of R statistical graph would be most appropriate for this scenario?
Scatter Plot
Histogram
Box and Whiskers Plot
Pie Chart
You are exploring the capabilities of interactive documents in R Markdown for building Shiny apps. What accurately describes the process of creating and launching an interactive document in R Markdown?
Interactive documents are standalone Shiny apps and cannot be launched directly from R Markdown
You write the interactive document in Shiny language and then convert it to R Markdown for rendering
An interactive document is an R Markdown file that includes only static text and visualizations, but not Shiny widgets or outputs
Interactive documents are R Markdown files containing Shiny widgets and outputs; you write the report in markdown and launch it as an app with the click of a button
In R Markdown, what is the role of the “knit” function in the document creation process?
It manually pastes graphs into the final report
It saves the R Markdown file as a separate document
It runs each chunk of R code and appends the results to the document
It compiles the R Markdown code into machine-readable format
You are working on an R Markdown document that includes both text and R code. What action do you need to take to produce a final, nicely formatted document in either HTML, PDF, or Word?
Save the document
Click the "Transform" button
Use the "Knit" button
Execute all R code chunks
In an R Markdown document, you want to include chunks of R code to perform analysis. Which syntax is used to surround these chunks of R code, allowing the document to execute and display the results?
---
%%%
<<<
` ` `
In an R Markdown document, you want to create a second-level header. Which syntax should be used to achieve this?
**Header 2**
## Header 2
# Header 2 #
Header 2
In R Markdown, what is the purpose of YAML, and what does YAML stand for?
YAML stands for Yet Another Markup Language, and it's used for creating headers in Markdown documents
YAML is a markup language specifically designed for creating interactive documents in R
YAML is a data serialization language used for writing configuration files and providing metadata instructions to R Markdown
YAML stands for Yet Another Markup Language, and it's the primary syntax for writing R code chunks
You are working on a data analysis project and need to create a dynamic report that includes both code and narrative. Which of the following options in R provides an efficient way to achieve this, allowing you to seamlessly integrate R code and text in a single document?
R Snippet
R Script
R Notebook
R Powerpoint
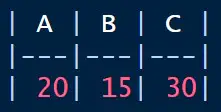
In your R Markdown document, you want to create a table to present summarized information. Which of the following R Markdown code snippets correctly generates a simple table with two columns ("Category" and "Count")?