wayground logo

Free Printable Worksheets

NEW

Font size

S
M
L
XL
Worksheets

Unit 3 Review

Total questions: 64

Worksheet time: 2hrs 18mins

Name
Class
Date
1.
The scatter plot shows the relationship between the number of chapters and the total number of pages for several books.  Use the trend line to predict how many chapters would be in a book with 180 pages. 
a)
12 chapters
b)
15 chapters
c)
18 chapters
d)
21 chapters
2.
What type of correlation (association)?
The outside temperature and the amount of layers you wear. 
a)
Positive correlation
b)
Negative correlation
c)
No correlation
d)
All of the above
3.

What type of correlation (association)?

The number of siblings you have and your weight.

a)

Positive correlation

b)

Negative correlation

c)

No correlation

d)

All of the above

4.

What type of correlation (association)?

The number of siblings you have and your weight.

a)

Positive correlation

b)

Negative correlation

c)

No correlation

d)

All of the above

5.
Which scatter plot shows a linear relationship between x and y?
a)
Graph A
b)
Graph B
c)
Graph C
d)
Graph D
6.
What is the correlation?
a)
Negative correlation
b)
No correlation
c)
Positive correlation
d)
All of the above
7.
As the age of the car increases, its value decreases. Which scatterplot represents this relationship?
a)
A
b)
B
c)
C
d)
D
8.
a)
440 turtles
b)
40 turtles
c)
150 turtles
d)
90 turtles
9.
What is a line of best fit used for?
a)
To make predictions
b)
To make the graph look pretty
c)
To connect the points
d)
To make it look like you know what you are doing
10.
What type of correlation does this graph have?
a)
positive 
b)
negative
c)
none
d)
all of the above
11.
What type of correlation does this graph have?
a)
positive
b)
negative
c)
none
d)
all of the above
12.
What type of correlation does this scatter plot show?
a)
positive linear association
b)
negative linear association
c)
no association
d)
nonlinear association
13.
About how many male math teachers were there in 2006?
a)
15
b)
30
c)
35
d)
45
14.
Write the equation for the line.
a)
y = 46x
b)
y = -1/2x
15.
Charlie rented a moving truck. He paid a daily fee plus a per-mile fee to rent the truck. The equation below represents the daily amount Charlie paid for the truck if he drives it x miles.
y=0.5x+10
What does the slope of the graph of this equation represent?
a)
The daily fee for the moving truck
b)
The per-mile fee for the moving truck
c)
How much Charlie paid for the truck
d)
The number of miles he drove
16.
Rich is a member of a gym. He pays a monthly fee plus a per-visit fee. The equation below represents the monthly amount Rich pays for his membership to the gym per month for x visits.
y=3x+10
What does the y-intercept of the graph of this equation represent?
a)
The monthly fee
b)
How much Rich pays per visit
c)
The number of times Rich goes to the gym
d)
The total cost at the end of the month
17.
Which of the following could be a possible line of best fit for the data?
a)
y = -5/2x + 20
b)
y = -x + 19
c)
y = x + 20
d)
y = 2/3x + 15 
18.
Which of the following could be a possible line of best fit for the data?
a)
y = 3x + 0
b)
y = 5/6x + 490
c)
y = -2x + 470
d)
non linear
19.
Which best describes the form of this scatterplot?
a)
linear
b)
nonlinear
c)
scattered
20.
The graph above shows a line of best fit for data collected on the distance bicyclists have remaining in relation to the amount of time they have been riding.  What is the equation of the line of best fit?
a)
y = -25x + 170
b)
y = 25x + 170
c)
y = -(5/8) x + 170
d)
y = (5/8) x + 170
21.
The graph above shows a line of best fit for data collected on the amount earned by waiters and waitresses last week in relation to the number of tables they served.  What is the equation of the line of best fit?
a)
y = (5/3) x + 375
b)
y = (1/3) x + 475
c)
y = (5/3) x + 475
d)
y = (1/3) x + 375
22.
A group of students did an experiment to see how drinking cups of coffee right before bed affected sleep.  The results are shown below in the scatter plot with a line of best fit.  Use the given line of best fit to approximate the rate of change relative to the scatter plot.
a)
(7/5) hours/cup
b)
(5/7) hours/cup
c)
- (7/5) hours/cup
d)
- (5/7) hours/cup
23.
A teacher made the following graph showing absences vs. final grades.  Predict the grade of a student that has 7 absences.
a)
45
b)
50
c)
60
d)
70
24.
Which scatterplot most likely has a line of best fit represented by y = - 2x + 1
a)
W
b)
X
c)
Y
d)
Z
25.
The graph shows a line of best fit for data collected on the amount of income earned by lawn companies in relation to the number of yards mowed.  What is the equation of the line of best fit?
a)
y = (3/2) x
b)
y = 30x
c)
y = 30x + 300
d)
y = (3/2)x + 300
26.
Looking at the graph showing a line of best fit, what is the correlation shown?
a)
Length of life is constant
b)
Length of life increases as amount of sunlight increases
c)
Length of life increases as amount of sunlight decreases
d)
Length of life decreases as amount of sunlight increases
27.
A teacher made the following graph showing the number of hours that a student studied for an exam versus their exam grade.  Predict the grade of a student if they studied for 3.5 hours.  
a)
80
b)
100
c)
85
d)
90
28.
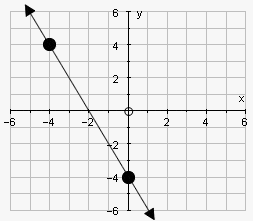
Find the slope of the line.
a)
-2
b)
2
c)
-1
d)
1
29.
Find the slope of the line.
a)
Undefined
b)
0
c)
1
d)
-1
30.
Find the slope of the line.
a)
1/2
b)
-1/2
c)
2
d)
-2
31.

Calculate the slope between the line that passes through

(3, 7) and (7, 2)

a)

54-\frac{5}{4}

b)

45-\frac{4}{5}

c)

5

d)

-4

32.

Calculate the slope of the line that passes through the

points (1, -8) and (-3, 0).

a)

4

b)

-1

c)

-2

d)

6

33.

What is the slope of these two points (5,-11) and (25,9)?

a)

23\frac{2}{3}

b)

11

c)

1-1

d)

32-\frac{3}{2}

34.

What is the slope (m) of the table?

a)

0

b)

3

c)

-3

d)

-1

35.
Find the slope:
a)
3/4
b)
4/3
c)
-3/4
d)
-4/3
36.
Find the slope:
a)
2
b)
-2
c)
1/2
d)
-1/2
37.
Find the slope:
y = 2x + 3
a)
0
b)
3
c)
1.5
d)
2
38.
Find the slope of:
(7,1) and (-2,1)
a)
0
b)
-1/2
c)
undefined
d)
-8
39.
Find the slope of:
(12,-2) and (4, -6)
a)
-1/2
b)
5/7
c)
-2
d)
1/2
40.

What is the slope of the table?

a)

15

b)

6

c)

1/6

d)

-6

41.

What is the slope of the table?

a)

1/2

b)

2

c)

-2

d)

3

42.

What is the slope of the table?

a)

1/4

b)

4

c)

-6

d)

-4

43.

What equation is represented by the table?

a)

y = 1/8x

b)

y = 8x

c)

y = x - 8

d)

y = x - 21

44.

Find the slope.

a)

1

b)

1/4

c)

3/5

d)

4

45.

Find the slope.

a)

1/3

b)

3

c)

-3

d)

7

46.

Find the slope.

a)

2

b)

-2

c)

1/2

d)

-4

47.

What is the slope of the graph?

a)

1/2

b)

0

c)

2

d)

-2

48.

What is the slope of the line?

a)

3

b)

1/3

c)

-3

d)

1/4

49.

What is the equation of the line?

a)

y = 1/2x

b)

y = x + 2

c)

y = 2x

d)

y = x - 2

50.
What is the slope?
a)
1/2
b)
2
c)
7
d)
3
51.
What is the slope?
a)
-1/3
b)
-3
c)
-4
d)
5
52.
a)
b=2
b)
m=3
c)
b=-3
d)
m=-2
53.
a)
b=1
b)
b=-1
c)
m=1
d)
b=4
54.
a)
b=2
b)
b=-2
c)
m=1
d)
b=0
55.
a)
b=2
b)
b=4
c)
m=4
d)
b=1
56.
a)
b=0
b)
b=-1
c)
b=1
d)
b=8
57.
a)
b=2
b)
b=-2
c)
b=0
d)
b=1
58.

What is the y-intercept shown on the graph?

a)

(2, 0)

b)

(-2, 0)

c)

(0, 3)

d)

(3, 0)

59.

Identify the y-intercept of the graph.

a)

(0, 3)

b)

(-1, 0)

c)

(0, -1)

d)

(3, 0)

60.
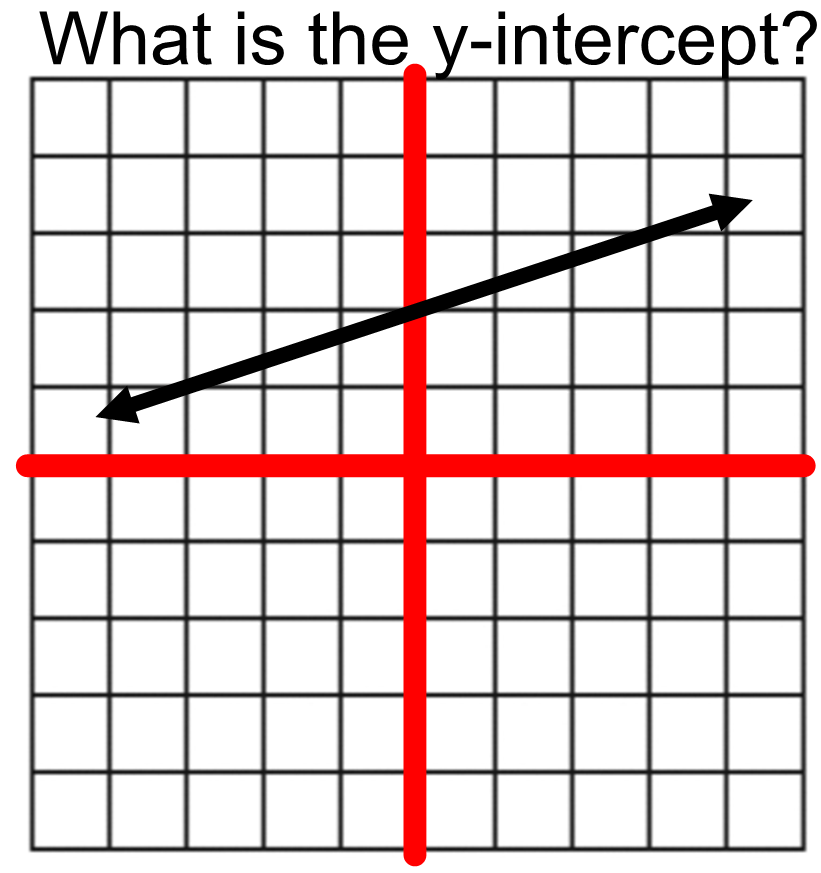
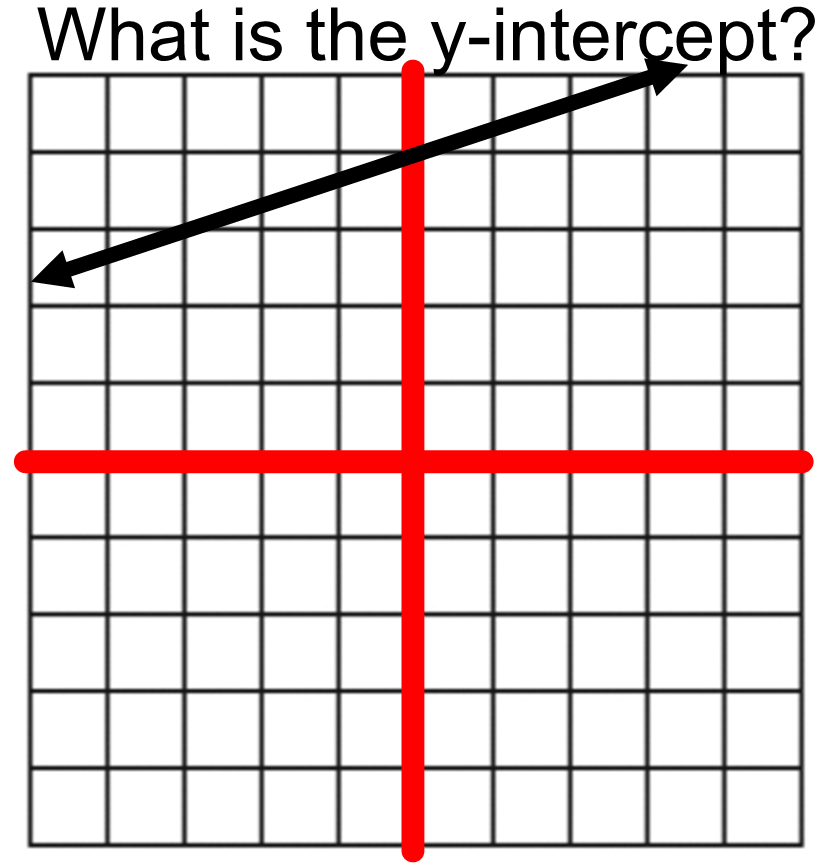
What is the y-intercept?
a)
-1
b)
3
c)
-3
d)
-2
61.
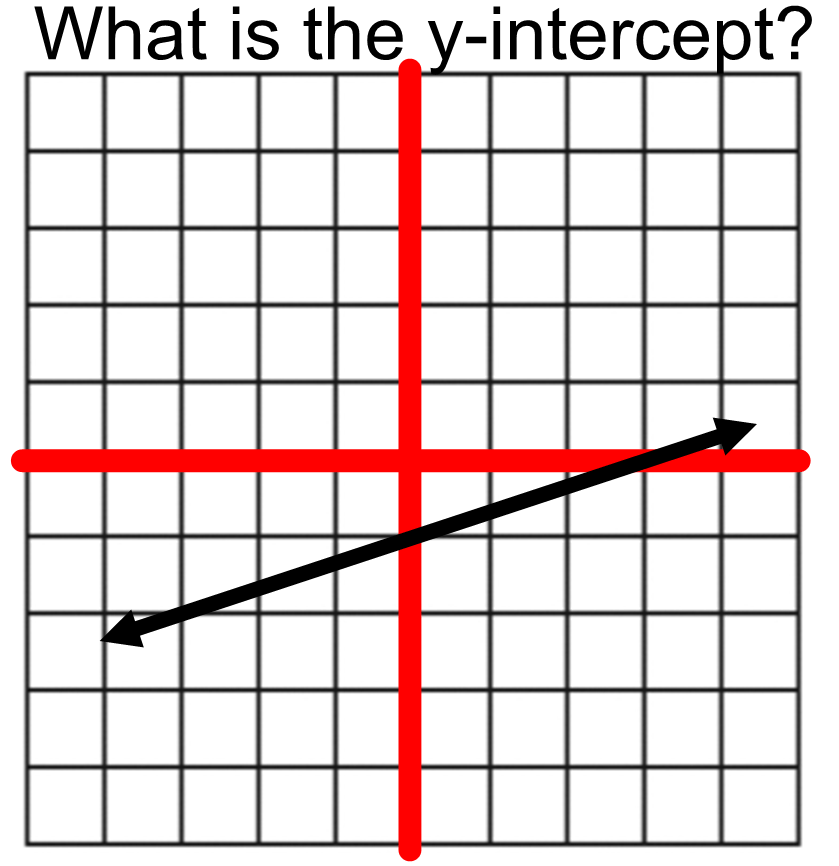
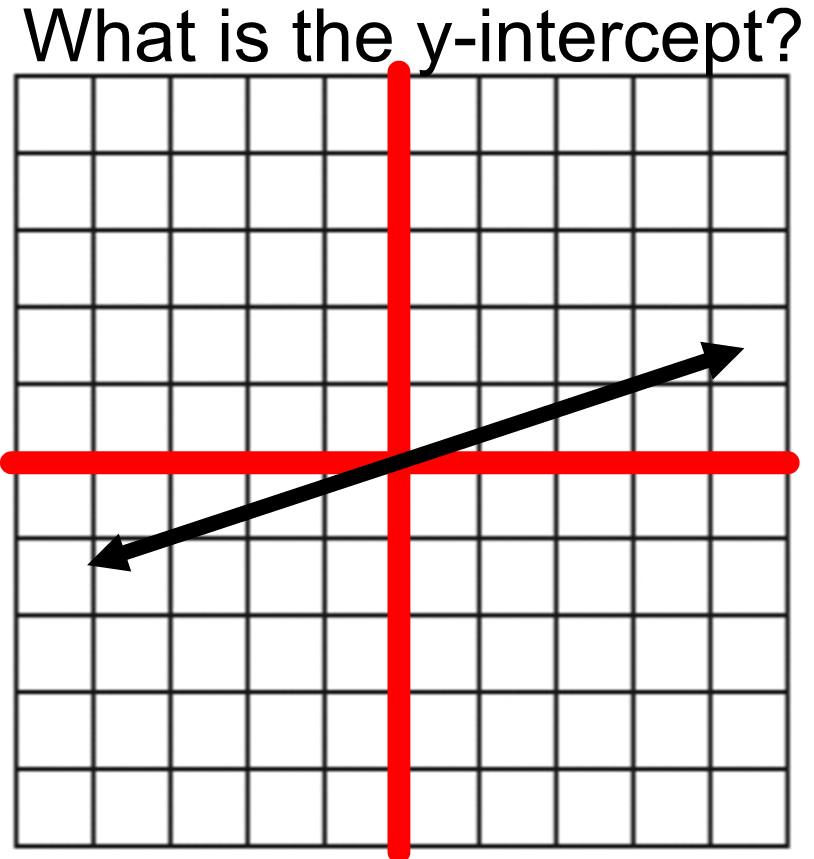
What is the y-intercept?
a)
9
b)
2
c)
7
d)
3
62.
What is the y-intercept in the equation y= -2x + 5
a)
-2
b)
3
c)
5
d)
-5
63.
Find the y-intercept
a)
(6,0)
b)
(0,6)
c)
(0,3)
d)
(0,1)
64.
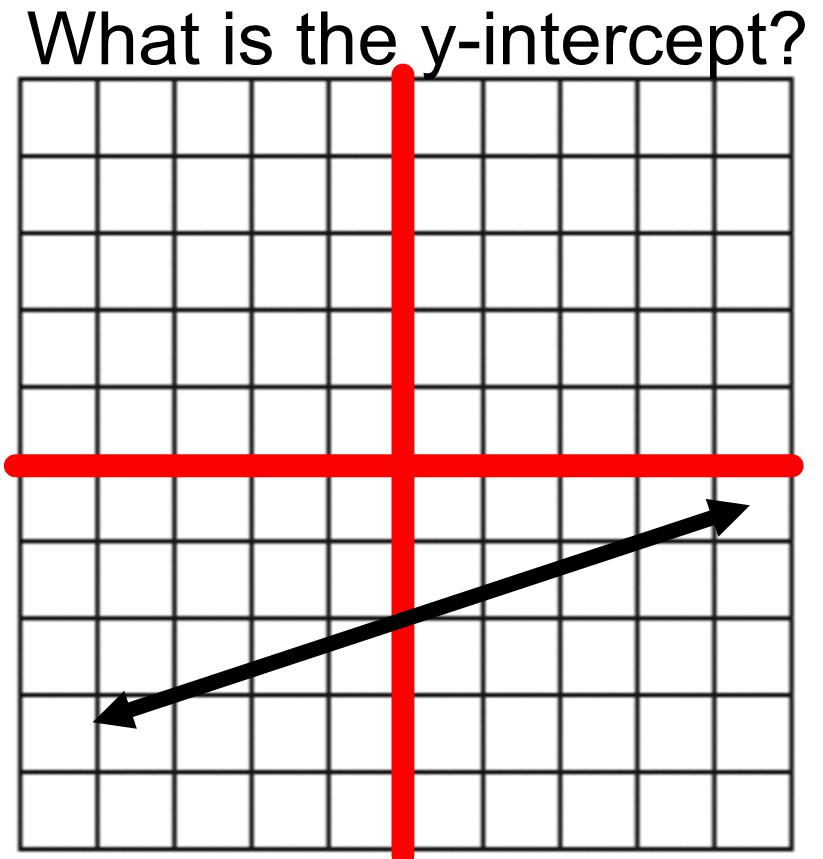
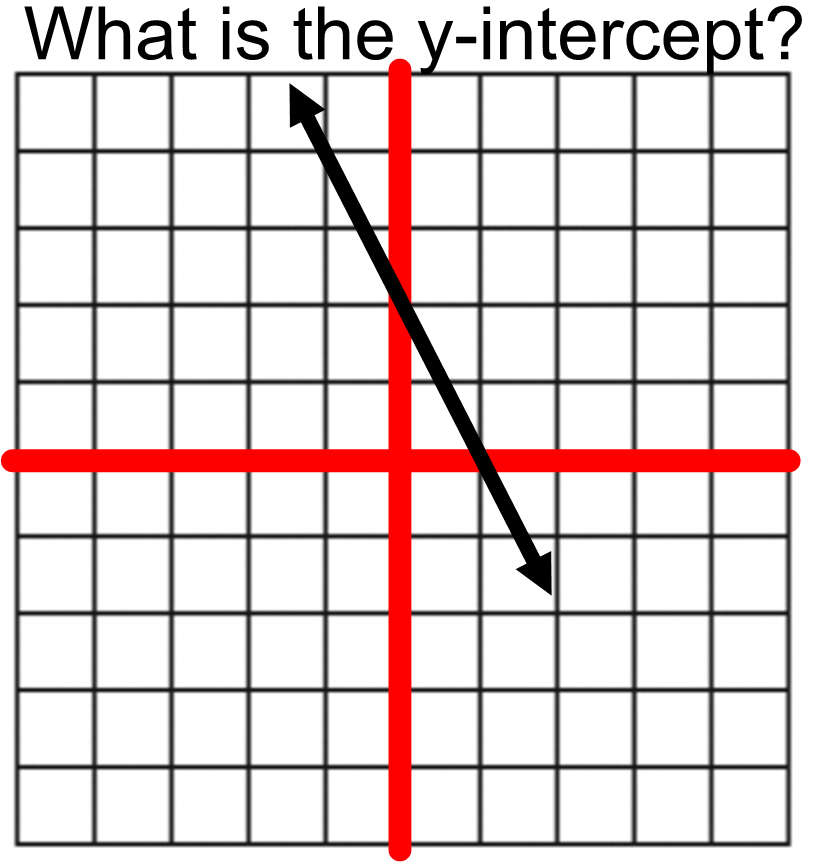
What is the y-intercept?
a)
(0,2)
b)
(6,0)
c)
(2,0)
d)
(0,6)