wayground logo

Free Printable Worksheets

Font size

S
M
L
XL
Worksheets

Scatter Plot review

Total questions: 93

Worksheet time: 23hrs 15mins

Name
Class
Date
1.
The following scatter plot shows Pam's training as she prepares to run a 6 mile race at the end of the month.  Which of the following would be a reasonable approximation for the length of time it would take for her to run 6 miles? 
a)
A. 50 min
b)
B. 80 min
c)
C. 45 min
d)
D. 60 min
2.
The scatter plot shows the relationship between the number of chapters and the total number of pages for several books.  Use the trend line to predict how many chapters would be in a book with 180 pages. 
a)
12 chapters
b)
15 chapters
c)
18 chapters
d)
21 chapters
3.
1.  Mrs. Collins made a scatterplot to show the relationship between the number of absences and a student’s final exam score. Based on this scatterplot, a student with 6 absences should get approximately what score on the final exam? 
a)
65
b)
92
c)
70
d)
76
4.
What type of correlation (association)?
The outside temperature and the amount of layers you wear. 
a)
Positive correlation
b)
Negative correlation
c)
No correlation
5.
What is the correlation between length of running start and distance of jump?
a)
positive:  the further you run the further you jump
b)
negative: the less you run the less distance of your jump
c)
positive: the further your running start the less your distance
6.
The scatter plot below shows the number of books read by students in Mrs. Hall’s English class and their final grades. Which statement represents the best description about the line of best fit?
a)
The more books students read, the lower their English grade.
b)
The more books students read, the higher their English grade.
c)
The fewer books students read, the higher their English grade. 
d)
No relationship exists between the number of books students read and their English grades. 
7.
Make a prediction for a resting heart rate after 6 hours of exercise a week.
a)
6
b)
50
c)
55
d)
59
8.
What type of correlation does this graph have?
a)
Negative 
b)
no association
c)
positive 
9.
Which scatter plot show a positive relationship?
a)
Graph A
b)
Graph B
c)
Graph C
d)
Graph D
10.
Which scatter plot shows no relationship?
a)
Graph A
b)
Graph B
c)
Graph C
d)
Graph D
11.
Which scatter plot shows a negative relationship?
a)
Graph A
b)
Graph B
c)
Graph C
d)
Graph D
12.
In the scatter plot, does the image shows a "Line of Best Fit"?
a)
Yes
b)
No
13.
The equation of the trend line
is  y= 1/2x +1. Use the equation to determine the amount of time it would take to bike 20 laps. 
*Look at the x and y axis first before starting the problem
   
a)
38 minutes
b)
11 minutes
c)
41 minutes
d)
10 minutes
14.
Find the slope for the trend line using points (2,2) and (4,3)
a)
2
b)
1/2
c)
-2
d)
-1/2
15.
a)
y = x ; 20
b)
y = x + 2 ; 22
c)
y = 2 ; 2
d)
y = 0.5x + 2 ; 12
16.
The following scatter plot shows Pam's training as she prepares to run a 6 mile race at the end of the month.  Which of the following would be a reasonable approximation for the length of time it would take for her to run 6 miles? 
a)
A. 50 min
b)
B. 80 min
c)
C. 45 min
d)
D. 60 min
17.
Based on this scatter plot, a student with 6 absences should get approximately what score on the final exam? 
a)
≅ 58
b)
≅ 92
c)
≅ 100
d)
≅ 76
18.
Which of the following lines represents the line of best fit for the scatter plot?
a)
A
b)
B
c)
C
d)
D
19.
Based on the graph, if Joe earned $400, how many hours did he work?
a)
20 hours
b)
35 hours
c)
45 hours
d)
15 hours
20.

What is the equation of the line of best fit?

a)

y = -25x + 170

b)

y = -5/8x + 170

c)

y = 25x + 170

d)

y = 5/8x + 170

21.
Based on the graph, if Joe earned $400, how many hours did he work?
a)
20 hours
b)
35 hours
c)
45 hours
d)
15 hours
22.
Which of the following lines represents the line of best fit for the scatter plot?
a)
A
b)
B
c)
C
d)
D
23.
Based on this scatter plot, a student with 6 absences should get approximately what score on the final exam? 
a)
≅ 58
b)
≅ 92
c)
≅ 100
d)
≅ 76
24.
The following scatter plot shows Pam's training as she prepares to run a 6 mile race at the end of the month.  Which of the following would be a reasonable approximation for the length of time it would take for her to run 6 miles? 
a)
A. 50 min
b)
B. 80 min
c)
C. 45 min
d)
D. 60 min
25.
Find the slope for the trend line using points (2,2) and (4,3)
a)
2
b)
1/2
c)
-2
d)
-1/2
26.
The equation of the trend line
is  y= 1/2x +1. Use the equation to determine the amount of time it would take to bike 20 laps. 
*Look at the x and y axis first before starting the problem
   
a)
38 minutes
b)
11 minutes
c)
41 minutes
d)
10 minutes
27.
In the scatter plot, does the image shows a "Line of Best Fit"?
a)
Yes
b)
No
28.
Which scatter plot shows a negative relationship?
a)
Graph A
b)
Graph B
c)
Graph C
d)
Graph D
29.
Which scatter plot shows no relationship?
a)
Graph A
b)
Graph B
c)
Graph C
d)
Graph D
30.
Which scatter plot show a positive relationship?
a)
Graph A
b)
Graph B
c)
Graph C
d)
Graph D
31.
What type of correlation does this graph have?
a)
Negative 
b)
no association
c)
positive 
32.
Make a prediction for a resting heart rate after 6 hours of exercise a week.
a)
6
b)
50
c)
55
d)
59
33.
The scatter plot below shows the number of books read by students in Mrs. Hall’s English class and their final grades. Which statement represents the best description about the line of best fit?
a)
The more books students read, the lower their English grade.
b)
The more books students read, the higher their English grade.
c)
The fewer books students read, the higher their English grade. 
d)
No relationship exists between the number of books students read and their English grades. 
34.
What is the correlation between length of running start and distance of jump?
a)
positive:  the further you run the further you jump
b)
negative: the less you run the less distance of your jump
c)
positive: the further your running start the less your distance
35.
What type of correlation (association)?
The outside temperature and the amount of layers you wear. 
a)
Positive correlation
b)
Negative correlation
c)
No correlation
36.
1.  Mrs. Collins made a scatterplot to show the relationship between the number of absences and a student’s final exam score. Based on this scatterplot, a student with 6 absences should get approximately what score on the final exam? 
a)
65
b)
92
c)
70
d)
76
37.

The following scatter plot shows Pam's training as she prepares to run a 6 mile race at the end of the month. Which of the following would be a reasonable approximation for the length of time it would take for her to run 6 miles?

a)

A. 50 min

b)

B. 80 min

c)

C. 45 min

d)

D. 60 min

38.

The following scatter plot shows Pam's training as she prepares to run a 6 mile race at the end of the month. Which of the following would be a reasonable approximation for the length of time it would take for her to run 6 miles?

a)

A. 50 min

b)

B. 80 min

c)

C. 45 min

d)

D. 60 min

39.

Do you have any questions?

4 lines
40.

Find the equation of the line of best fit for the given data

a)

y = 163.41x+1.49

b)

y =- 163.41x+ 4.19

c)

y =- 4.19x+163.41

d)

y = 4.19x -163.41

41.
The scatter plot shows the relationship between the number of chapters and the total number of pages for several books.  Use the trend line to predict how many chapters would be in a book with 180 pages. 
a)
12 chapters
b)
15 chapters
c)
18 chapters
d)
21 chapters
42.
If Joe worked 30 hours, how much is he expected to earn?
a)
$600
b)
$200
c)
$1000
d)
$800
43.
What is the type of correlation?
a)
Negative 
b)
no association
c)
positive 
44.
Which scatter plot shows a linear relationship between x and y?
a)
Graph A
b)
Graph B
c)
Graph C
d)
Graph D
45.
What is a line of best fit used for?
a)
To make predictions
b)
To make the graph look pretty
c)
To connect the points
d)
To make it look like you know what you are doing
46.

The linear model to represent the distance (in miles) traveled given the time (in hours) driving is 

m=1.79+61.93hm=-1.79+61.93h . Predict how far a person will travel driving 10 hours. 

a)

617.51 miles

b)

621.09 miles

c)

100 miles

d)

0.19 miles

47.

Write the linear regression equation for the following data points. Round to the nearest hundredth.

a)

y=0.83x+0.61y=-0.83x+0.61

b)

y=0.83x+0.63y=-0.83x+0.63

c)

y=0.83x+0.8y=0.83x+-0.8

d)

a2+b2=c2a^2+b^2=c^2

48.
What type of association does this graph show?
a)
Positive
b)
negative
c)
none
d)
all of the above
49.

Is this line an accurate line estimate of best fit for the data?

a)

Yes

b)

No

50.

Is this line an accurate line estimate of best fit for the data?

a)

Yes

b)

No

51.

What is the equation of the line of best fit

a)

y= -2x + 10

b)

y= 10x+ 2

c)

y=2x+10

d)

y= 10

52.

Which sentence describes the relationship shown on this scatter plot?

a)

As the temperature decreases, the visitors increase.

b)

As the temperature increases, the number of visitors increases.

c)

As the visitors increase, the temperature decreases.

d)

No correlation

53.

This measures how strong or weak the relationship between 2 quantitative variables are.

a)

Scatter Plot

b)

Causation

c)

Correlation

d)

Line of best fit

54.

What does the value, r= -0.89, tell us about the linear relationship of two quantitative variables?

a)

Strong positive

b)

Weak positive

c)

Strong negative

d)

Weak negative

55.

What is the y-intercept?

a)

-2

b)

3

c)

2

d)

-3

56.
Select the statement that best describes the line.
a)
The line is the line of best fit.
b)
The line is NOT a line of best fit because it does not pass through two points.
c)
The line is NOT a line of best fit because it does not go through the middle of the data set.
d)
The line is NOT a line of best fit because it does not go through the origin.
57.
Which of the following lines represents the line of best fit for the scatter plot?
a)
A
b)
B
c)
C
d)
D
58.
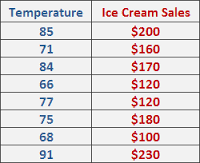
The red line represents the line of best fit for the scatter plot. How many ice cream sales are expected if the temperature is 90°?
a)
55
b)
0
c)
103
d)
100
59.
3c + 5 = 23
a)
c = 3
b)
c = 6
c)
c = 7
d)
c = 18
60.
What is the first step to solve this equation:
11 - 3x = 44
a)
Add 3 to both sides
b)
Subtract 11 from both sides
c)
Add 11 to both sides
d)
Divide 3 on both sides.
61.
Figure out what n equals in this equation:
6n + 4 = -26
a)
n=-6
b)
n= -5
c)
n= 8
d)
n= -4
62.
In the equation 4y - 9 = -36
y = -4
a)
True
b)
 False
63.
5x + 4 = −6
a)
2
b)
-2
c)
10
d)
15
64.
-4x + 1 = 21
a)
x=120
b)
x=5
c)
x=30
d)
x=-5
65.
 x - 4 = 12
a)
x = 8
b)
x = 16
c)
x = -8
d)
x = 3
66.
2x + 6 = 14
a)
x = 4
b)
x = 10
c)
x = -4
d)
x = 3
67.
-3x + 5 = -13
a)
x = -5
b)
x = 2
c)
x = -6
d)
x = 6
68.
x / 2  - 5 = 3
a)
x = -2
b)
x = 2
c)
x = 16
d)
x = 8
69.
6p - 5 =13
a)
12
b)
15
c)
3
d)
-3
70.
Solve for x:
-30 - 5x = 120
a)
x = 18
b)
x = -18
c)
x = 30
d)
x = -30
71.
15 = 2a + 7
a)
2
b)
4
c)
12
d)
14
72.
Solve for w:
-6w + 1 = -11
a)
2
b)
1.2
c)
12
d)
-2
73.
x/5 - 13 = 20
a)
145
b)
165
c)
180
d)
190
74.
4x + 22 = -34
a)
-14
b)
-22
c)
16
d)
-20
75.
Solve   -5t + 9 = 24
a)
-3
b)
3
c)
12
76.
WRITE AN EQUATION
You bought a $5 magazine and four
erasers. You spent a total of $25. How
much did each eraser cost?
a)
5+x=25
b)
5+4x=25
c)
5x=25
d)
23-5=4x
77.
4x + 7 = 23
a)
x = 16
b)
x = 4
c)
x = 9
d)
x = 12
78.
WRITE AN EQUATION
331 students went on a field trip. Six buses were filled and 7 students traveled in cars. How many students were in each bus?
a)
331=7x+6
b)
331=13x
c)
331=6x+7
d)
331-7=6x
79.
Which equation represents the following graph?
a)
y = 3x + 2
b)
y = -2x + 3
c)
y = 2x + 3
d)
y = -3x + 2
80.

What is the y-intercept in the equation?

y = 5x - 4

a)

(0,5)

b)

(0,-4)

c)

(-4,0)

d)

(5,0)

81.
Find the slope
a)
-5/3
b)
-3/5
c)
5/3
d)
3/5
82.

What is the y-intercept for the given graph?

a)

(0,-5)

b)

(0,5)

c)

(0,1)

d)

(0,-1)

83.
Find the slope of the line.
a)
1/2
b)
-1/2
c)
2
d)
-2
84.
Which is the graph of y=-x+2?
a)
A
b)
B
c)
C
d)
D
85.
What is the y-intercept?
a)
7
b)
0
c)
1
d)
2
86.
Find the value of y when x = 2.
a)
2
b)
6
c)
7
d)
8
87.
Find slope:
a)
m= 4
b)
m=1/4
c)
m=-4
d)
m=-1/4
88.
Find the slope between the two given points: (-2,1) and (5,7)
a)
7/6
b)
2
c)
6/7
d)
-2
89.
a)
Function
b)
Not a Function
90.
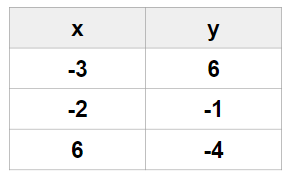
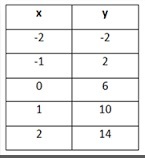
Which equation best represents the relationship between x and y in the table shown?
a)
y= 5x+5
b)
y=1/5x+5
c)
y=15x+5
d)
y=10x+5
91.
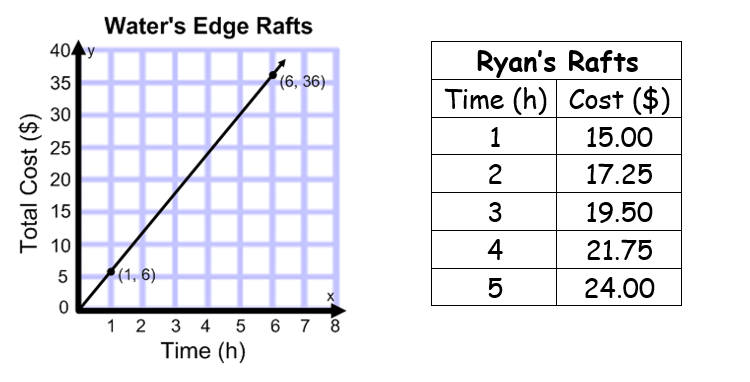
Which company shows a greater rate of change?
a)
Water's Edge Rafts
b)
Ryan's Rafts
92.
Which panda is growing faster?
a)
Mochi
b)
Kappa
c)
Po the dragon warrior
d)
Jack Black
93.
Jenny went to the sale at Kohl's last weekend.  
T-shirts were on sale for $15 each and hoodies were on sale for $20 each.  If she spent $150 total, write an equation to represent this situation.  

a)
20x + 15 = y 
b)
35x = y 
c)
15x + 20y = 150 
d)
150 - 20x = 15y