
NEW
Font size
 Worksheets
Price System in the Microeconomy (14 -16)
Total questions: 18
Worksheet time: 33mins
What is most likely to improve the allocative efficiency of a market?
a higher market concentration ratio
collusion between firms in the market
entry of new firms into the market
mergers of firms in the market
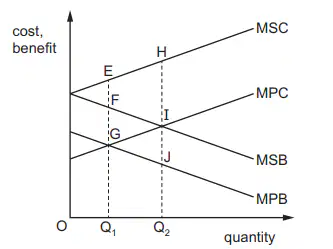
The diagram shows a market in which there are negative externalities of production and positive externalities of consumption.
What is the marginal external cost at the free market equilibrium level of output?
EG
EF
FG
HI
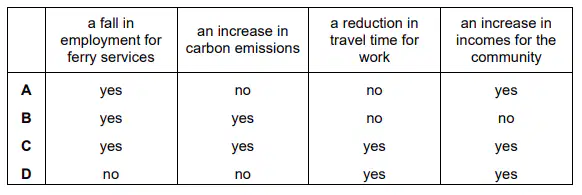
What could be included in a cost-benefit analysis of a project to build a road bridge connecting an island community to the mainland?
A
B
C
D
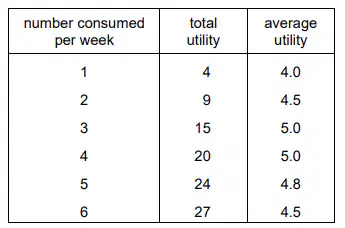
The table shows the levels of total and average utility at different levels of a consumer’s weekly consumption of a product.
After which level of weekly consumption does the diminishing marginal utility first occur?
3
4
5
6
Which statement about a budget line in consumer behaviour theory is correct?
It illustrates consumer preference between two goods.
It illustrates combinations of two goods that consumers are able to purchase with a given income.
It illustrates the least cost combination of goods that yield the same level of utility.
It illustrates the income effect of a price change.
When the price of a good increases, which statement is correct according to the analysis that uses budget lines and indifference curves?
The income and substitution effects of the price increase will work in opposite directions in the case of a Giffen good.
The income effect of the price increase will result in reduced consumption for all goods.
The new equilibrium position will be where the new budget line meets the original indifference curve.
The price rise will be represented by a parallel shift inwards of the original budget line.
When is Pareto efficiency achieved?
at a level of output that is productively and allocatively efficient
when everyone has equal amounts of goods and services
when social benefits are greater than private benefits
when social marginal benefit is greater than social marginal cost
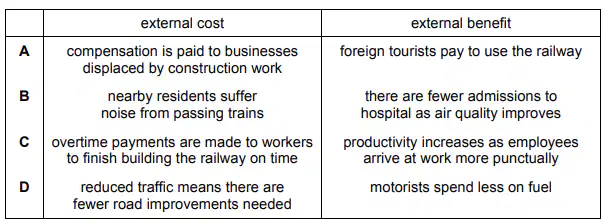
The transport authority in a city is considering building an underground railway to reduce traffic congestion on the roads. Which combination would represent an external cost and an external benefit of the use of this railway?
A
B
C
D
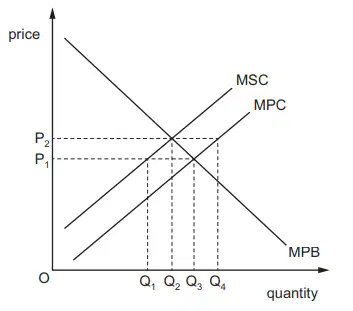
The diagram shows the marginal private benefit (MPB), the marginal private cost (MPC) and the marginal social cost (MSC) of a firm producing chemicals. In a free market, price is at P1.
Which quantity measures the overproduction of chemicals resulting in the negative production externality?
Q1, Q2
Q1, Q3
Q2, Q3
Q3, Q4
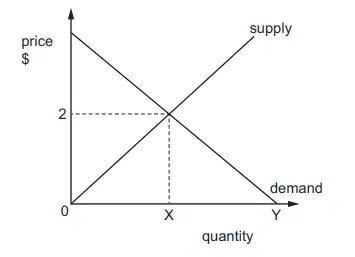
The diagram shows the market price and equilibrium quantity of coffee consumed by an individual, Jo. Jo buys X cups of coffee at $2 per cup when she visits her favourite café.
When she is there, the café owner says it is offering unlimited free refills. How is her consumption most likely to change?
Jo’s demand for coffee will increase from X to Y where her total utility for coffee is zero.
Jo’s demand for coffee will increase from X to Y where her marginal utility for coffee is zero.
Jo will not drink extra coffee because its marginal utility is less than $2.
Jo will not drink extra coffee because her total utility will fall.
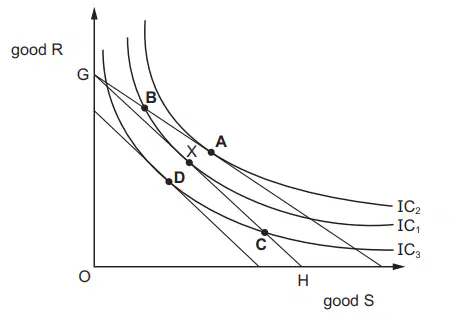
The diagram shows a consumer’s initial budget line is GH and a set of indifference curves IC1, IC2 and IC3 for goods R and S. The original equilibrium for the consumer is point X. The inflation rate is rising faster than money incomes. What will be the most likely new equilibrium for the consumer if all real income is spent?
A
B
C
D
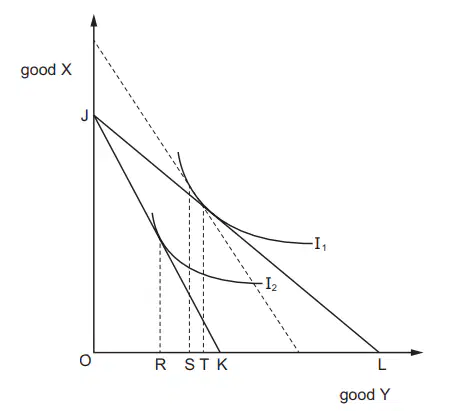
The diagram shows an individual’s budget lines and indifference curves. The initial budget line is JL. There is then an increase in the price of good Y.
Which distance represents the substitution effect of the increase in price of good Y?
LK
SR
TS
TR
In an economy, no-one can be made better off without making someone else worse off.
What can be deduced from this?
Individuals are the best judges of their own well-being.
Individuals can be relied upon to behave rationally.
The distribution of income is socially optimal.
The economy’s resources are allocated efficiently.
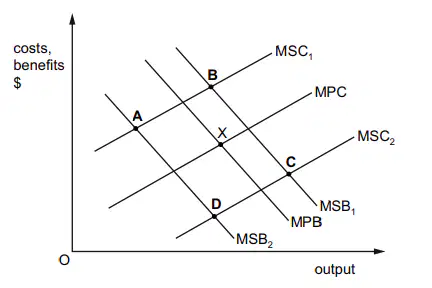
The diagram shows the costs and benefits of producing a good. The good has negative externalities in production and positive externalities in consumption. The free market equilibrium is at point X.
What is the new equilibrium point when the externalities are taken into consideration?
A
B
C
D
The Airports Commission in the UK recommended an expansion of airport X rather than airport Y. In considering the social costs and benefits of this decision, what would be taken into account when calculating the external cost?
the additional noise pollution suffered by residents local to airport X
the financial loss suffered by airlines operating at airport Y
the increase in profits of the firm operating airport X
the monetary cost of the construction to expand airport X
What is a correct statement of the equi-marginal utility rule?
The marginal utility of X must equal the marginal utility of Y.
The marginal utility of X divided by the price of X must equal the marginal utility of Y divided by the price of Y.
The marginal utility of X divided by the price of Y must equal the marginal utility of Y divided by the price of Y.
The price of X must equal the price of Y
Which statement is correct?
A budget line shows the combinations of two goods which can be bought with a given income.
A budget line shows the combinations of two goods which a consumer wants to buy.
A budget line shows the difference between income and expenditure.
A budget line shows the maximum potential output of two goods with given resources.
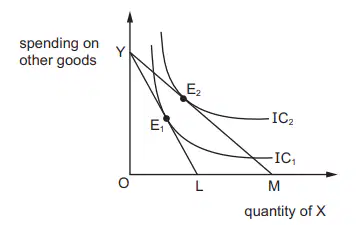
In the diagram, YL and YM show two budget lines for a consumer of a product, X, when its price changes. IC1 and IC2 are two indifference curves, representing the consumer’s preferences between product X and spending on other goods.
What is not a valid statement?
Product X must be a Giffen good, since the consumer spends more on other goods after the price change.
The consumer has greater satisfaction at E2 than at E1.
The prices of other goods are assumed to be held constant when drawing the budget lines.
The shift from YL to YM represents a fall in the price of product X.

