
 Worksheets
Thursday Graphs quiz
Total questions: 8
Worksheet time: 8mins
Name
Class
Date
1.

How many students spent 7 hours doing homework that week?
a)
1
b)
3
c)
5
d)
6
2.

How many students received a score in the 80's?
a)
2
b)
10
c)
14
d)
27
3.

How many students take the bus to school?
a)
35
b)
20
c)
10
d)
15
4.
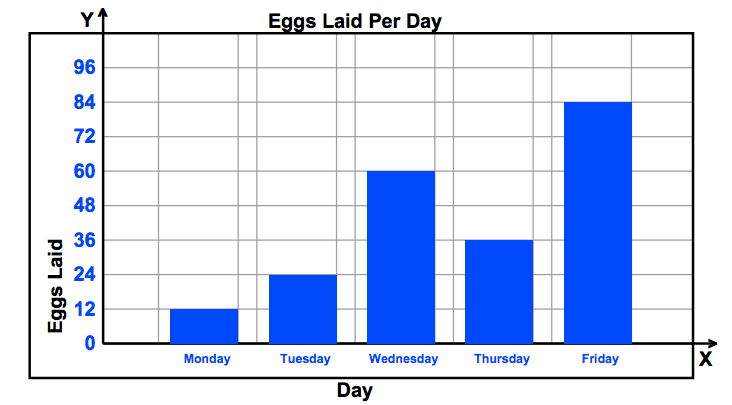
How many more eggs were laid on Friday than Wednesday?
a)
84
b)
36
c)
24
d)
60
5.

How many more students like soccer than basketball?
a)
24
b)
15
c)
10
d)
17
6.

How many people have two or less books in their desk?
a)
4
b)
5
c)
6
d)
7
7.

What percentage does the entire circle graph represent?
a)
100%
b)
50%
c)
25%
d)
15%
8.

The pie chart shows the colors of crocs in a store. What percent of the crocs are pink?
a)
5%
b)
20%
c)
155%
d)
45%
100 %

