
 Worksheets
Supply and Demand - Curves and Graphs
Total questions: 13
Worksheet time: 10mins

The diagram represents a(n)
increase in supply
decrease in supply
change in quantity supplied
none of the above
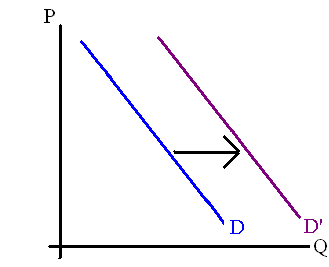
The diagram represents a
increase in demand
decrease in demand
change in quantity demand
none of the above
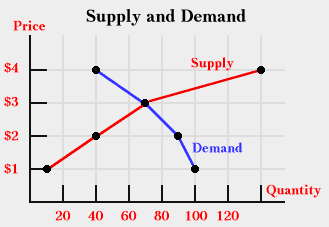
What is the Equilibrium Price?
1
2
3
4

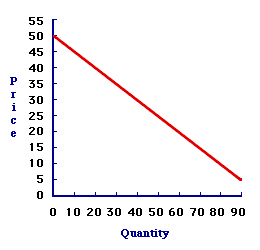

If the government set the price at $3 what would it be?
a price floor
a price ceiling
a surplus
equilibrium

Which area indicates a shortage?
A
B
C
D
Which area indicates a surplus?
A
B
C
D

Preference for the product goes down and causes the demand curve to decrease and shift left. What will be the new equilibrium price and quantity in this case?
$5 and 1,000
$10 and 1,500
$7.5 and 1,250

Cost of Production drops and causes the supply to increase and the supply curve to shift right. What will be the new equilibrium price and quantity in this case?
$6 and 20,000
$4 and 30,000
$6 and 40,000

Refer to the diagram. A price of $15 in this market will result in:
Equilibrium
Surplus
Shortage

