wayground logo

Free Printable Worksheets

Font size

S
M
L
XL
Worksheets

Unit 4 Test: Circles and Area

Total questions: 22

Worksheet time: 51mins
Name
Class
Date
1.
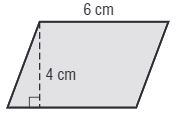
Find the area of the figure.
a)
10 cm2
b)
24 cm2
c)
12 cm2
d)
20 cm2
2.

What is the formula to find the AREA of any parallelogram?

a)

a = b + ha\ =\ b\ +\ h

b)

a=lwa=lw

c)

a = b÷ha\ =\ b\div h

d)

a = bha\ =\ bh

3.

Find the area of the square.

a)

10 cm2

b)

20 cm2

c)

25 cm2

4.

What is the height of the given triangle?

a)

21 mm

b)

66 mm

c)

33 mm

5.

Find the area of the triangle.

a)

30 cm2

b)

35 cm2

c)

25 cm2

6.

Calculate the area of the triangle.

a)

52.4 square kilometers

b)

74 square kilometers

c)

148 square kilometers

d)

27.4 square kilometers

7.
What is the formula for circumference of a circle given the diameter?
a)
C = π r
b)
C = 2 π r
c)
C = π d
d)
C = 2 π d
8.
The _____ is the distance from the center to any point on the circle.
a)
diameter
b)
radius
c)
π
d)
center
9.
The distance across a circle through its center is called the _____.
a)
diameter
b)
radius
c)
π
d)
center
10.

what is the formula for finding area of a circle

a)

C = π r2

b)

A = π r2

c)

A = π r2 / 2

d)

C = 2 π r

11.
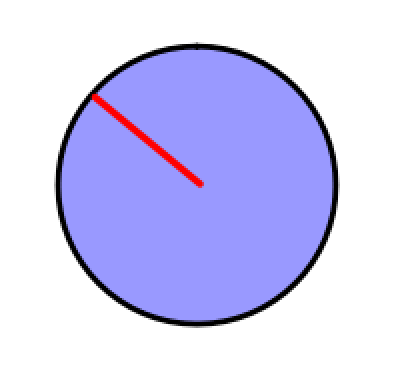
Is the red line a radius or diameter of the circle?
a)
Radius
b)
Diameter
12.
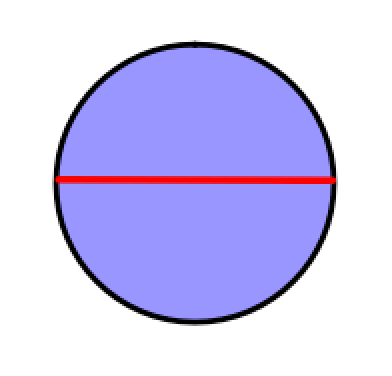
Is the red line a radius or diameter of the circle?
a)
Radius
b)
Diameter
13.

What is the area of this circle?

a)

28.26 cm2

b)

28.26 cm

c)

9.42 cm2

d)

9.42 cm

14.
Steven purchases a bowl. The diameter of the
bowl is 14 cm. What is the circumference of the 
bowl?
a)
28 cm
b)
43.98 cm
c)
87.96 cm
d)
7 cm
15.
Calculate 25% of 80
a)
20
b)
80
c)
48
d)
95
16.
What is 30% of 50?
a)
16
b)
16.3
c)
17.4
d)
15
17.
According to this graph, what is the most popular flavor of Jolly Rancher?
a)
Cherry
b)
Grape 
c)
Blue Rasberry
d)
Watermelon
18.
What percentage does a whole circle graph represent?
a)
360%
b)
90%
c)
50%
d)
100%
19.
When done correctly, the sector angles on a circle graph should add up to...
a)
100%
b)
360 Degrees
c)
90 Degrees
d)
50%
20.
Students were surveyed about their favorite sports to play in phys.ed. The results are represented in this circle graph. If 48 students were surveyed, how many chose soccer?
a)
10
b)
12
c)
15
d)
14
21.

The circle graph shown shows the results of a survey about favorite pizza toppings for people living in the United States. If this survey included 2,500 people, how many people said cheese is their favorite topping? (hint: multiply the percent by the number of people!!)

a)

100 people

b)

625 people

c)

10,000 people

d)

1,250 people

22.

If this survey included 2,500 people, how many people said they like sausage on their pizza?

a)

625 people

b)

375 people

c)

167 people

d)

16,600 people