
 Worksheets
7.6-1 Making Sense of Local Data
Total questions: 12
Worksheet time: 6mins
Name
Class
Date
1.
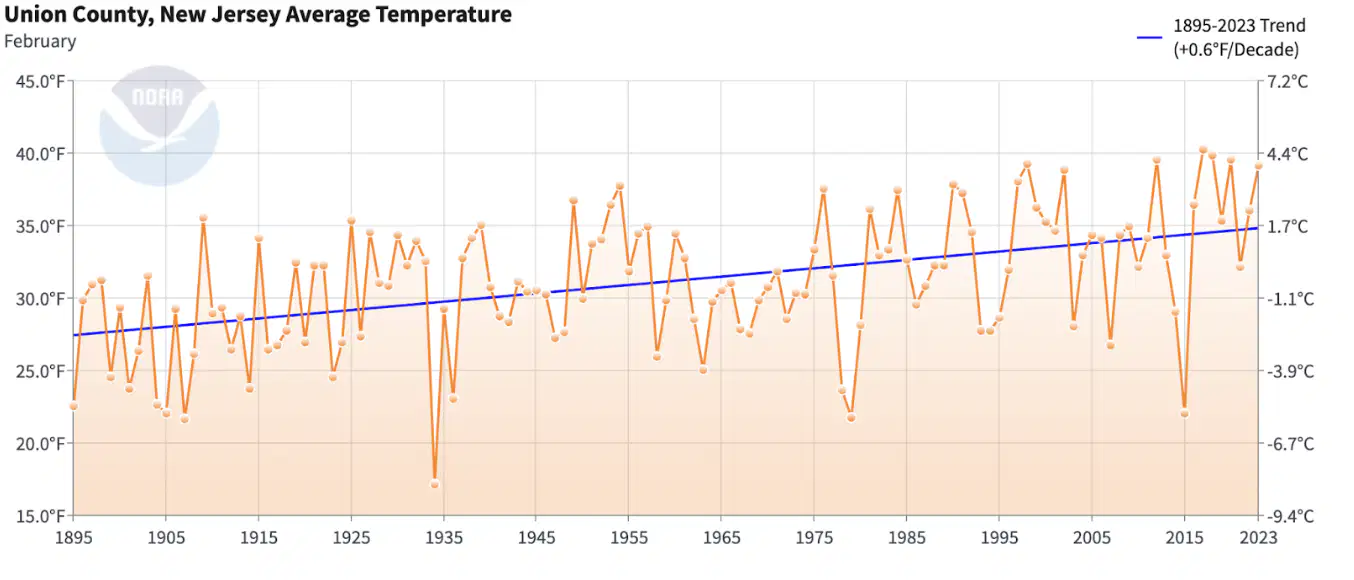
What is the overall trend on average temperature for our county?
a)
Increasing
b)
Decreasing
c)
Mostly stayed the same
2.

What decade had the LOWEST recorded average temperature
a)
1925-1935
b)
1905-1915
c)
1915-1925
d)
1935-1945
e)
1945-1955
3.
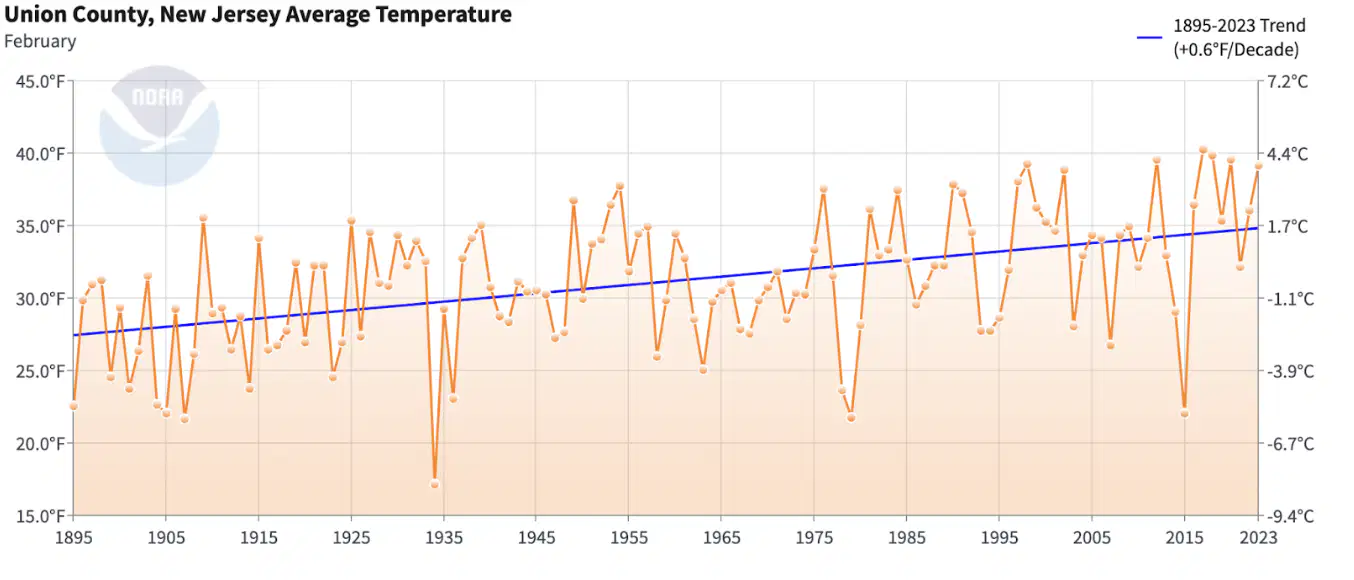
What is the average temperature change per decade according to the data?
(a)
4.
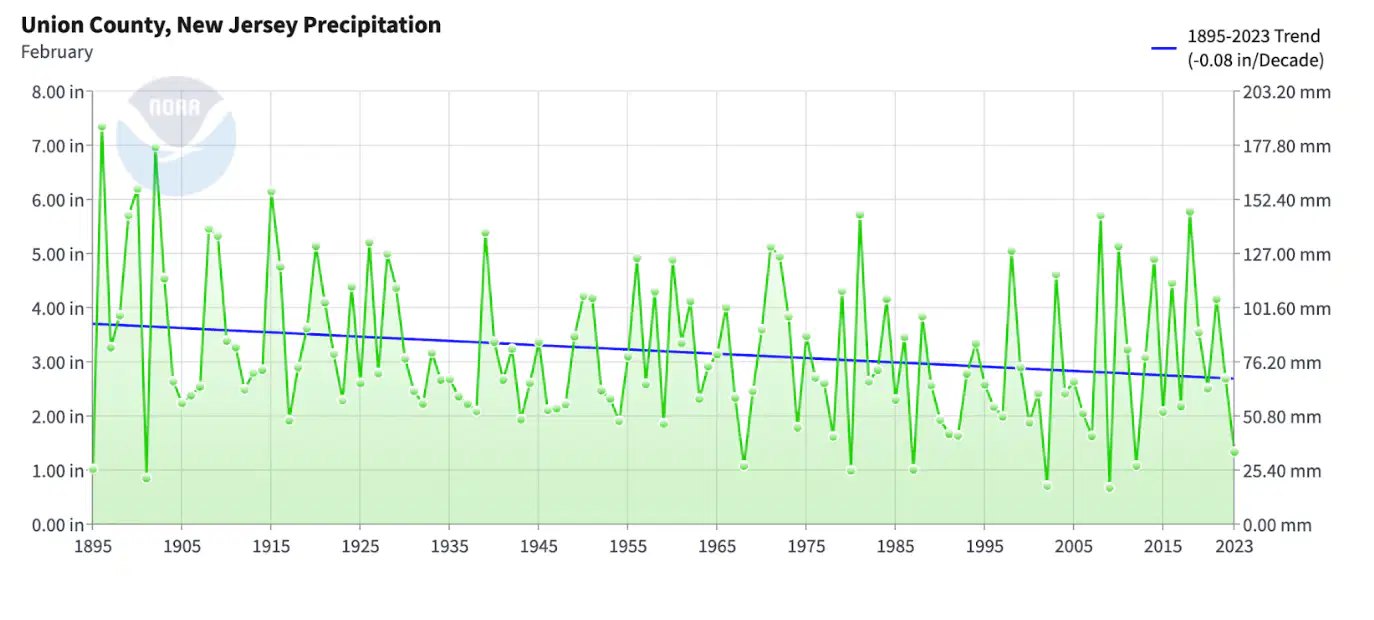
What is the overall trend in average precipitation for our county?
a)
Increases
b)
Decreases
c)
Stays mostly the same
5.

Which decade had the HIGHEST average precipitation on record?
a)
1895-1905
b)
1905-1915
c)
1915-1925
d)
1925-1935
e)
1935-1945
6.
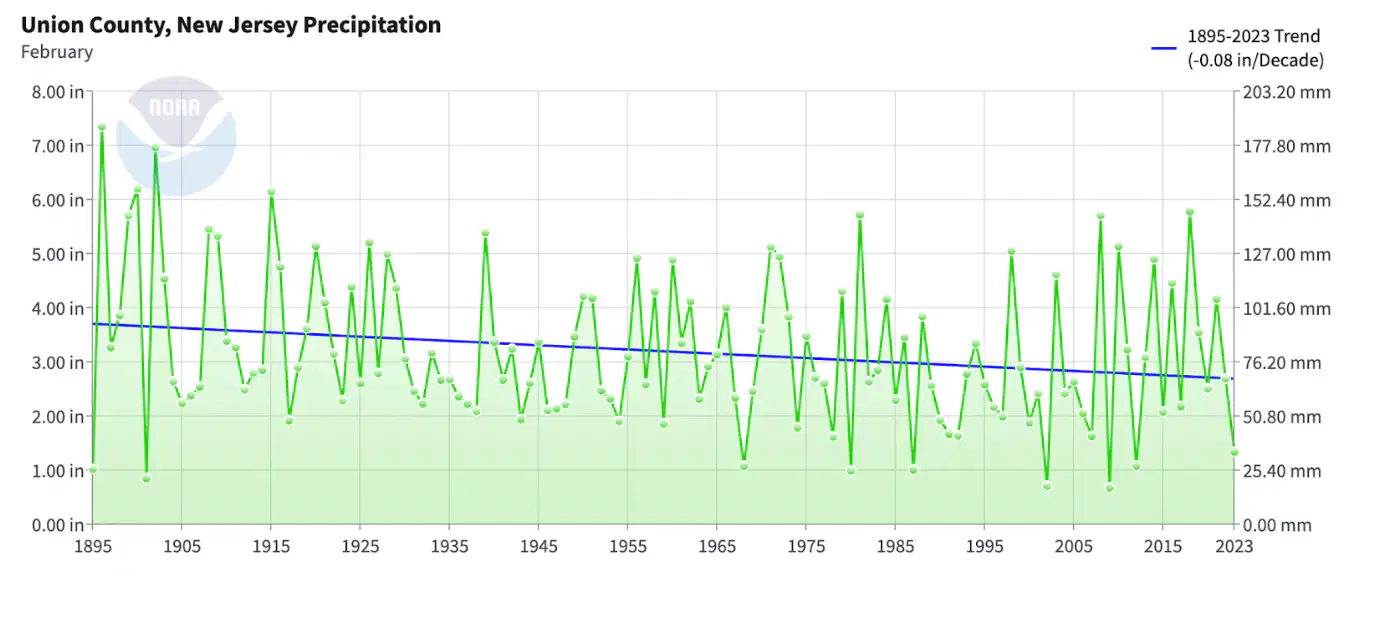
What is the average precipitation change per decade according to the data?
(a)
7.

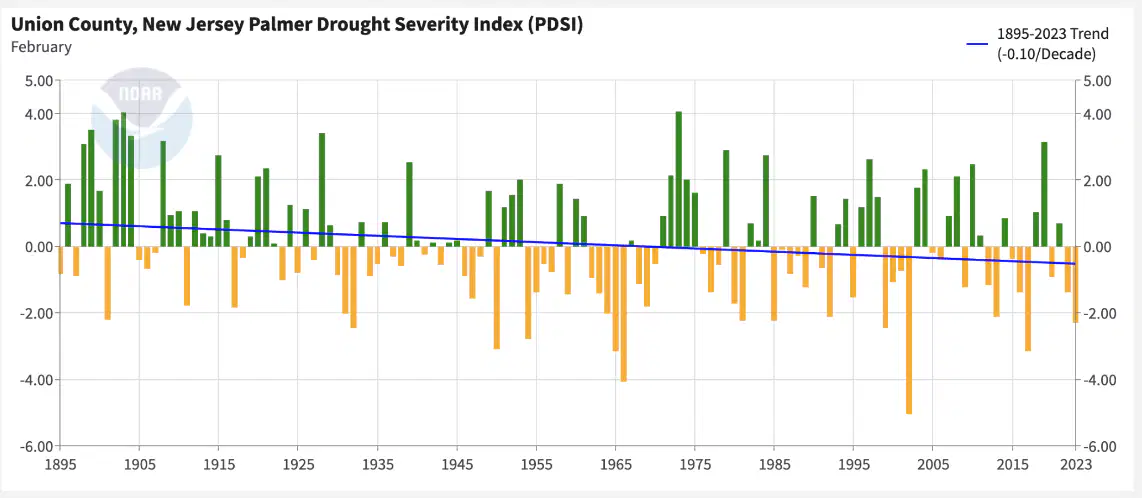
Which decade had the most severe chance of drought according to the data?
a)
1995-2005
b)
1895-1905
c)
1905-1915
d)
1915-1925
e)
1925-1935
8.
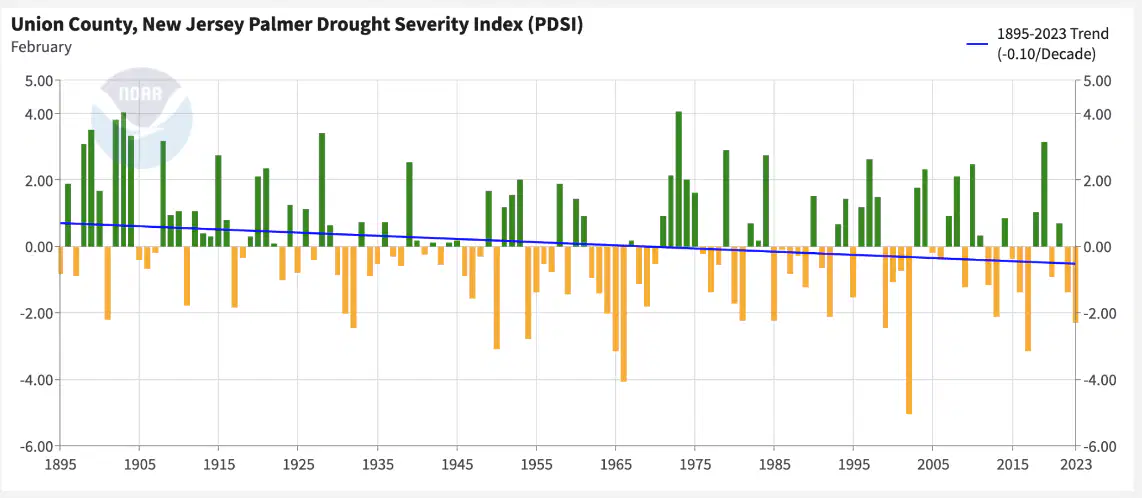
What the average change per decade according to the data?
(a)
9.
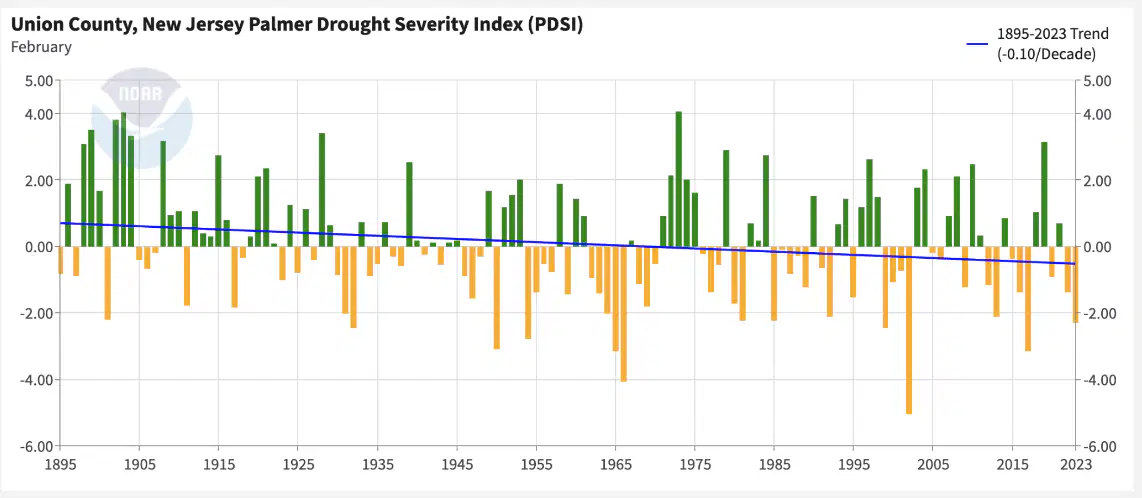
Based on the data in the 1800s we were more likely to experience a ____________________.
a)
Flood
b)
Drought
10.
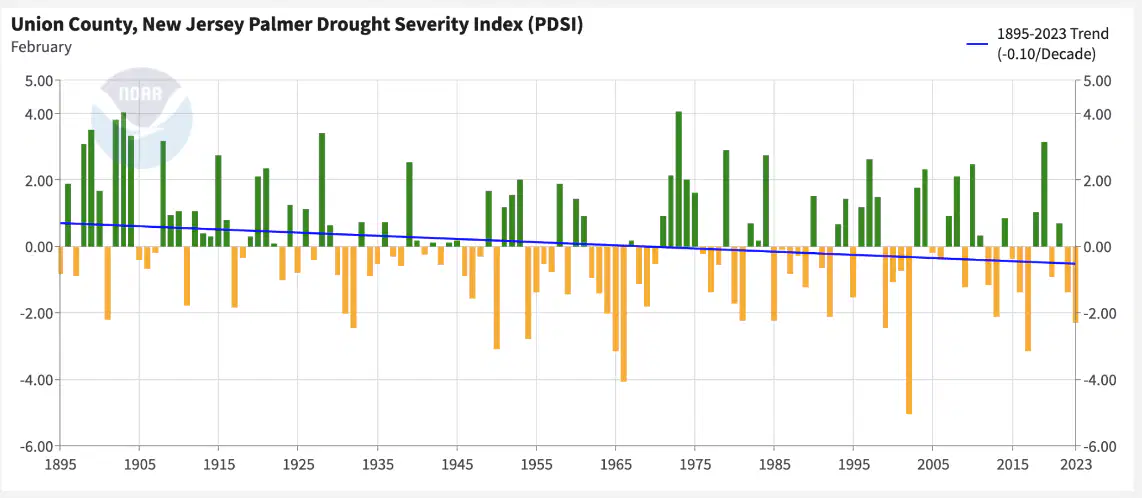
Based on the data in the next decade we are more likely to experience a ____________________.
a)
Flood
b)
Drought
11.
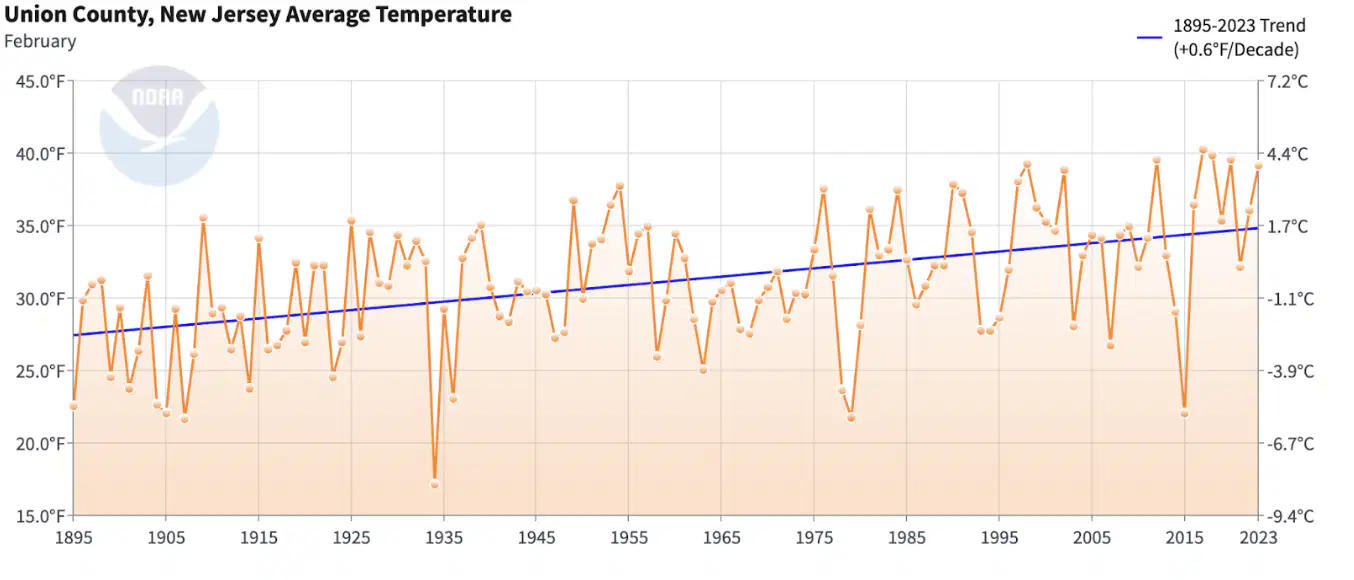
Which decade experienced the most significant increase in average temperature?
a)
1985-1995
b)
1995-2005
c)
2005-2015
d)
2015-2025
12.
How does the data correlate average temperature with the likelihood of extreme weather events?
a)
Higher temperatures increase the likelihood
b)
Lower temperatures increase the likelihood
c)
No correlation
100 %

