
 Worksheets
DATA
Total questions: 80
Worksheet time: 3hrs 40mins
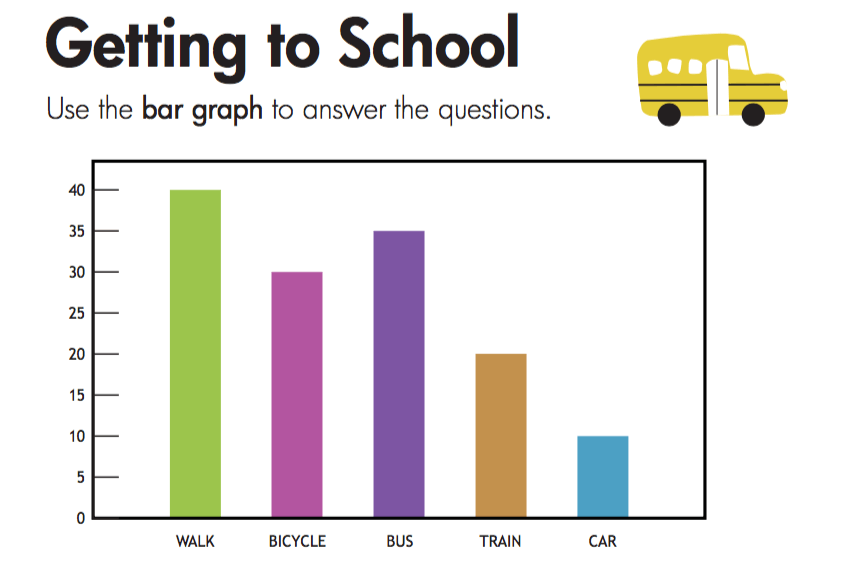


Figure 2 shows five societies participated by students on a co-curricular day. How many students are there on that day?
115
125
130
135

what fruit do students like the most?
(a)

which fruit do students like the least
(a)

how many more students like apples than oranges?
(a)

how many fewer like oranges then bananas?
(a)

how many students like apples and oranges?
(a)

which fruit do 7 children like?
(a)

The bar chart shows the number of students who wear spectacles and the number of students who do not wear spectacles in four Form 2 classes. Find the total number of students in Form 2 Blue class. (Write your answer in NUMBER only.)
(a)

The bar chart shows the number of students who wear spectacles and the number of students who do not wear spectacles in four Form 2 classes. Calculate the total number of students who do not wear spectacles in all the four classes.
(Write your answer in NUMBER only.)
(a)

What was the highest number of goals scored in a match ?
1
2
3
6

How many matches did football team score 4 goals?
1
2
3
4

How many number of goal has the same frequency
2
3
4
6

How many matches got 3 goals?
2
3
4
5

Rozi collected data about his classmate favourite animal. How many friends who likes parrot as pet?
10
7
12
11

What animal has least likes?
budgie
rabbit
lizard
hamster

Kirsty bakes cakes to sell at a cafe. How many cakes did Kirsty on Tuesday?
30
32
35
31

How many more cakes on Wednesday and Thursday?
10 cakes
25 cakes
20 cakes
15 cakes

How many learners chose lemon?
105
110
120
103

How many more learners chose mango drink than pineapple drink?
5
10
15
20

What day is the lower temperature in a week?
Tuesday
Wednesday
Sunday
Thursday

Which pattern is he most likely to choose?


Which spinner is the arrow most likely to land on a 2?
A
B
C
D
23, 25, 20, 24, 20, 22, 21, 20. The mode is...
23
20
25
24

How many cars were sold on Wednesday?
4
6
5
7

On how many cars were the maximum number cars sold?
6
9
4
10

How many hot dogs were sold on Monday?
2
4
6
8
4, 6, 5, 6, 7, 9, 3. The mode is ...
4
7
6
9

How many more hot dog were sold on Thursday than Friday?
6
3
4
2
3, 2, 1, 2, 3, 5, 6, 4, 6, 3. The mode is...
6
3
2
4




Which two animals are same in number?
Lions and ducks
whales and ducks
lion and tortoise

How many tortoises are there in this picture?
3
2
1
5

How many colours are there in this flag?
3
4
2

This pic is showing junk food
false
true

number of students in class 1_______
38
31
49
40

How many total votes were collected?
5
10
15
20

How many cupcake on Wednesday?
4
24
8
42

Which pet got the most votes?
Dog
Cat
Fish

Which fruit did most children choose?
Apple
Banana
Grapes

Tick one box below that shows all of the animals Dexter saw


Which tally chart shows the right number of each snack?


How many tortoises are there in this picture?
3
2
1
5
How many colours are there in this flag?
3
4
2
This pic is showing junk food
false
true


How many people like soccer?
7
8
3
6

How many apples were sold in Mar?
2
3
30
25

How many colours are there in Belgium flag?
4
3
2
5

How many colours are there in this flag?
3
2
1
0

What is this type of graph called?
Line plot
Bar graph
Pictograph

Tita went to the zoo. Which tally chart shows the right number of each animals?


How many elephant inside the zoo?
(a)
Which two animals are same in number?
Lions and ducks
whales and ducks
lion and tortoise

How many ducks are there in this picture?
4
5
3

Banyak siswa yang memperoleh nilai lebih dari 8 dari diagram tersebut adalah …
6 orang
7orang
9 orang
15 orang
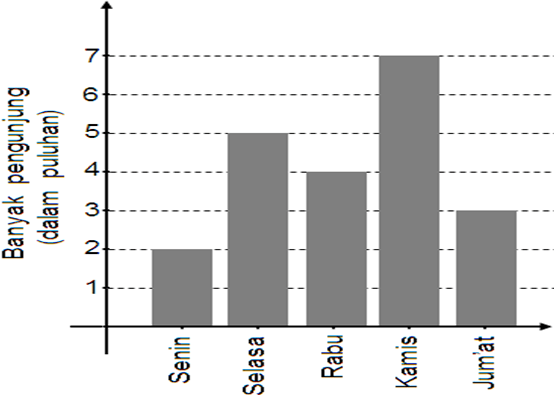
Banyak pengunjung yang paling sedikit adalah hari ....
Senin
Rabu
Kamis
Jum'at
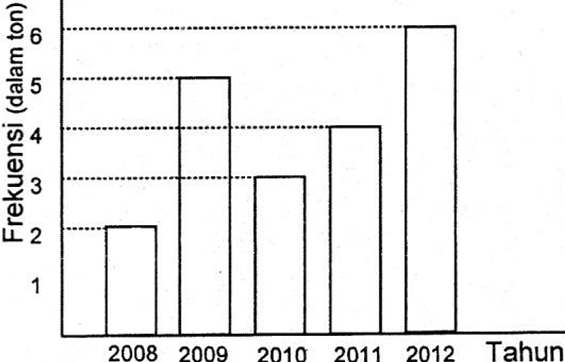
Jumlah hasil panen pada tahun 2010 dan tahun 2011 adalah …
3 ton
4 ton
7 ton
10 ton
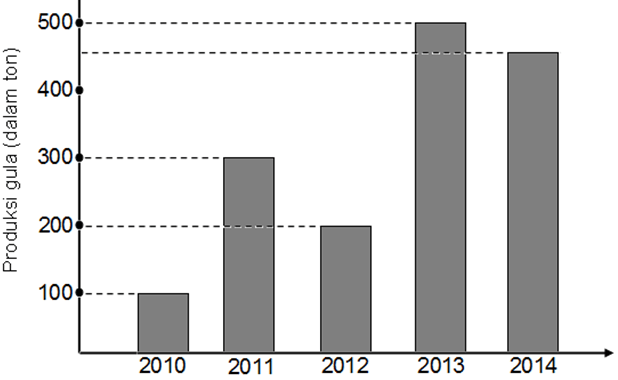
Selisih produksi gula pada tahun 2010 dan 2014 adalah ...
100 ton
250 ton
300 ton
350 ton

Pernyataan yang benar berdasarkan tabel di atas adalah
Penjualan sarung pada bulan November sebanyak 260 buah
Penjualan baju koko pada bulan September sebanyak 300 buah
Penjualan sarung pada bulan Oktober sebanyak 150 buah

Berapa total persentase ternak sapi, kerbau, dan bebek pak mamat?
90%
85%
80%
75%
Apa saja bentuk penyajian data ?
Tabel dan Daftar
Diagram dan Grafik
Tabel dan Diagram
Diagram dan Pengelompokan
Berikut ini adalah data nilai siswa kelas 5 SD Sukamaju saat ulangan matematika.
7, 8, 8, 9, 9, 9, 9, 6, 7, 8, 9, 10, 8, 8, 7, 6, 6, 7, 9, 9, 6, 7, 9, 8, 10, 9.
Jumlah siswa yang mengikuti ulangan matematika adalah ....
28 orang
27 orang
26 orang
25 orang
Berikut ini adalah data tinggi badan siswa kelas 5 Robbani dalam (cm).
140 143 145 146 141 140 143 143 145 143
140 142 143 147 146 140 142 145 142 147
141 142 145 145 143 142 146 134 130 134
Jumlah siswa yang mempunyai tinggi badannya 143 cm ada . . . .
5 anak
6 anak
7 anak
15 anak
Berikut ini adalah data nilai siswa kelas 4 SD Bahagia saat ulangan IPA.
10 8 8 9 9 10 9 6 7 8 9 10 8
8 7 6 6 7 9 9 6 7 9 8 10 9
Siswa dengan nilai tertinggi berjumlah . . . .
2 anak
3 anak
4 anak
5 anak

Jumlah siswa yang berat badannya kurang dari 37 kg ada . . .
5
9
10
14

Perhatikan diagram gambar di atas!
Penjualan mobil pada hari Kamis adalah ....
4 mobil
6 mobil
8 mobil
10 mobil

Perhatikan diagram lingkaran di bawah ini untuk mengisi soal nomer 17 – 20
Berikut ini adalah diagram yang menunjukkan jumlah panen yang dihasilkan oleh Desa Sukarukun pada tahun 2017 dengan total hasil panen mencapai 400 ton.
Jumlah panen terbanyak adalah ....
Kedelai
Semangka
Padi
Jagung

Berdasarkan diagram gambar diatas, penjualan sapi untuk qurban pada tahun 2009 adalah ....
7.000 ekor
9.000 ekor
10.000 ekor
11.000 ekor

Banyaknya persen padi yang dikonsumsi oleh warga kota Bandung berdasarkan diagram lingkaran diatas adalah ...
15 %
25 %
35 %
45 %

