
 Worksheets
MTH 180S Exam 2 Ch 2 and 3
Total questions: 17
Worksheet time: 44mins

What type of correlation does the graph show?
Positive Correlation
Negative Correlation
No Correlation
Which graph depicts the strongest positive correlation?


Which value represents the strongest negative correlation?
-0.7
-0.8
-0.83
-0.084

As shown in the table, a person's target heart rate during exercise changes as the person gets older. Use the graphing calculator to find the correlation coefficient (r).
-0.999
-0.664
0.998
1.503
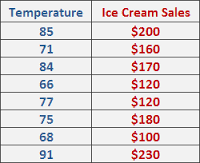
If x is temperature and y is coffee sales, use the following formula to determine the coffee sales on a 34° day.
y = -60x+6443
$4403
$4673
$8483
$6443

In the clothing store, the probability of randomly selecting a jacket is 34%. What's the probability of its complement?
P(not jacket)= 56%
P(jacket) = 66%
P(not jacket) = 50%
P(not jacket) = 66%

The two-way table above gives information about the grades for the semester in Mrs. Hardcase’s English class.
2) What is the probability a randomly selected student is male?
12/100
17/100
44/100
56/100
The two-way table above gives information about the grades for the semester in Mrs. Hardcase’s English class.
4) Given that the grade is an A, what is the probability of the student being female?
8/20
12/20
8/44
12/56

What is the probability of selecting a green candy from the pictured candy bar?
Certain
Likely
Unlikely
Impossible

P(Pizza ∪ Water) =
264/400
42/400
58/400
264
42

