
 Worksheets
Bar Graphs & Line Plots, Day 3
Total questions: 20
Worksheet time: 5hrs 0mins

The graph shows how employees at Disney World travel to work. How many employees ride bikes, ride the bus, or walk to work?
300
450
325
375

What is the difference between the amount of 3rd graders who own a dog than a snake or hamster combined?
8
2
6
4

Jack made this graph to show the number of movies that were rented from his store during four months. Which whole number shows how many more movies were rented in December than in September?
20
35
45
80

The bar graph shows the number of hamburgers sold at Bob’s Burger Shack. On which days were more than 80 hamburgers sold?
Wednesday and Friday
Tuesday and Thursday
Monday, Tuesday, and Thursday
Tuesday, Wednesday, Thursday, and Friday


Which of the following statements is supported by the information in the graph?
a. Mrs. Black's class collected more total pounds of aluminum cans than Mr. Luna's class.
b. My Luna's class collected more total pounds of aluminum cans than Mrs. Black's class.
c. Mrs. Black's class and Mr. Luna's class collected equal amounts of aluminum cans.
d. Each class collected less than 20 pounds of aluminum cans.

Which school has more than twice as many girls as East Side?
Ginn
Fox
Parkdale
not here
Which is NOT a true statement about Fairview School District?
a. Parkdale has 25 more boys than girls.
b. Ginn and East Side have an equal number of students.
c. The total number of students at East Side equals the number of boys at Parkdale.
d. Fox has 100 more girls than East Side.

According to the double bar graph , how many students together like mango and chocolate ice - cream ?
2
1
90
40
Kay has 45 pennies, 24 nickels, 36 dimes, and 18 quarters in her bank. Bo has 6 quarters, 5 dimes, 39 nickels, and 10 pennies in his bank.
Which graph matches this data?


Mrs. Ratas’ class made a bar graph of the number of pets each student has.
Choose the number of pets that is most common in Mrs. Ratas’ class.
0
1
2
3

Look at the bar graph, "Nicest Fruit". What does the y-axis show?
Types of fruit
Number of people.

Based on the graph,how many more sunny days than rainy days did this city have during the months of April, May, and June?
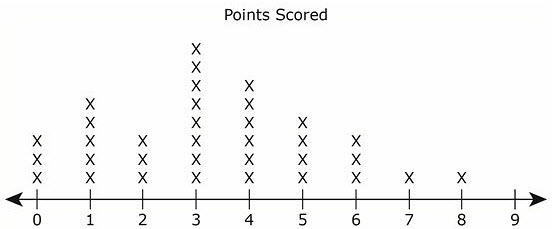
What is the difference between the number of players who scored fewer than 4 points and the number of players who scored more than 4 points?



How many fewer runs did the Bears score than the Cubs and Lions combined?
18
23
12
8

How would this bar graph look if we added 5 more students to Syria?



