
NEW
Font size
 Worksheets
CSP Unit 5 - Data
Total questions: 15
Worksheet time: 8mins
Which of the following could a photographer NOT find in the metadata of a photo?
Date Taken
Time Taken
Device Taken On
What is in the photo
Due to a computer error, the Time metadata for all of the photographs is accidentally set to the same time of day. Which of the following is MOST likely to be the result of this problem?
The photographer will not be able to view any of the images
The photographer will not be able to sort images by the date they were taken
The photographer will not be able to find images taken on the same date
The photographer will not be able to filter to photographs taken in the morning
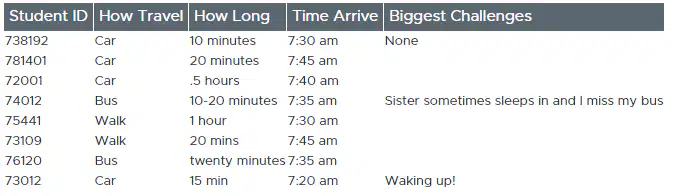
A school is conducting a survey of students to learn more about how they get to school. Students were asked how they travel to school, how long it takes them to get to school, what time they arrive at school, and for a description of their most significant challenges when traveling to school. Several rows of the data collected are shown in the table below.
Which column is data that will likely be most difficult to visualize or analyze?
Biggest Challenges
Time Arrive
How Long
How Travel
A school is conducting a survey of students to learn more about how they get to school. Students were asked how they travel to school, how long it takes them to get to school, what time they arrive at school, and for a description of their most significant challenges when traveling to school. Several rows of the data collected are shown in the table below.
Which column of data might be able to be visualized or analyzed but first would need to be cleaned?
Biggest Challenges
Time Arrive
How Long
How Travel
A school is conducting a survey of students to learn more about how they get to school. Students were asked how they travel to school, how long it takes them to get to school, what time they arrive at school, and for a description of their most significant challenges when traveling to school. Several rows of the data collected are shown in the table below.
Which information could likely NOT be found with the data collected?
The average time it takes students to get to school
Whether students who are new to the school take longer to get to school than other students
The most common travel mode students use to get to school
Whether students who arrive to school later take longer to get to school
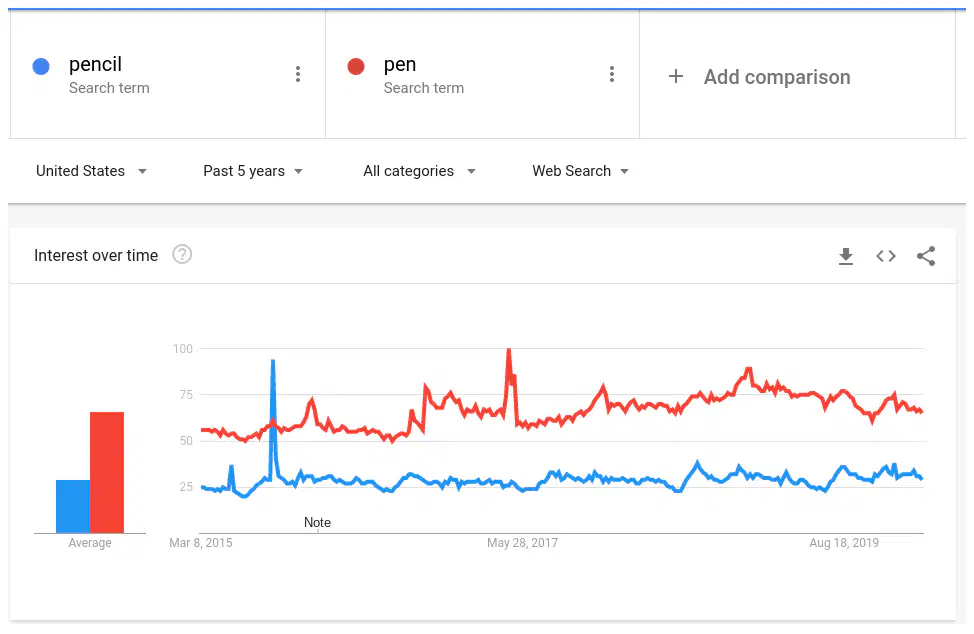
The chart above shows the frequency of searches for the words "pencil" and "pen" over a 5 year period. Which of the following is the best interpretation of the chart above?
More people use pens than pencils
The number of pens sold has increased slowly over time
At any point in time there are typically more people searching for the word "pen" than "pencil"
Pens are a better writing tool than pencils
You are surveying your community about potential issues it may have.
Which of the following strategies is MOST likely to address concerns about the data being biased or inaccurate.
Finding the same people surveyed previously to ask more detailed questions.
Visiting the same neighborhood to collect more survey responses
Having her staff collect the data using an app rather than paper surveys
Visiting multiple new neighborhoods to collect more survey responses
In which of the following situations would parallel systems MOST likely be used to help analyze data?
Data analysis involving two or more columns of data
Data analysis involving both string and numeric data
Data analysis involving large datasets
Data analysis that could result in two or more different types of visualizations
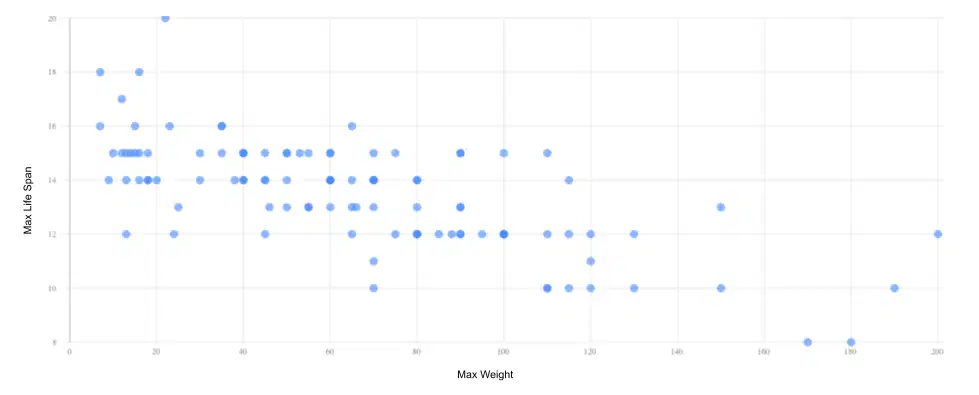
Which of the following conclusions is BEST supported by the scatter plot?
Older dogs weigh more than younger dogs
Dog breeds with a higher maximum weight tend to have shorter maximum lifespans
Dog breeds with a higher maximum weight tend to have longer maximum lifespans
All dog breeds tend to have the same average lifespan
Which of the following conclusions is BEST supported by the scatter plot?
Most dogs breeds have a maximum weight of 100 lbs or more
Most dog breeds have a maximum life span of 10 or fewer years
All dog breeds that weigh less than 50 pounds have a maximum lifespan of more than 10 years
No dog breeds that weigh more than 150 pounds are expected to live more than 10 years.

Which of the following conclusions is BEST supported by the histogram chart?
More than half of all states are larger than 100,000 square miles
More than half of all states are smaller than 50,000 square miles
Some states are larger than 200,000 square miles
The most common size of states is between 50,000 and 100,000 square miles
A bank is developing an algorithm that will help them decide who to make loans to. As input the algorithm will consider information about the person applying for the loan and the amount of money requested, and as output the algorithm will decide whether the bank should give that loan.
The bank intends to develop the algorithm using machine learning techniques. The algorithm will be trained using data from past loan decisions made by human bankers.
Which of the following best describes whether this algorithm will include bias?
The algorithm will not be biased because using machine learning eliminates human biases
The algorithm will likely reflect the human biases in the data used to train it
Machine learning algorithms cannot be developed using biased data so if there is bias in the data it will be impossible to develop the algorithm
While the algorithm may be biased, the eventual decision made by the algorithm will not be
A restaurant is interested in learning about the food preferences of people living nearby to the restaurant and intends to use survey data to help decide which new items to add to the menu. Which of the following is LEAST likely to be part of the process used to analyze the data?
Cleaning data to remove inconsistencies
Iteratively creating visualizations to ask and answer new questions
Cleaning a data visualization to remove unwanted patterns
Filtering the data to look at the responses from only certain groups
A researcher is interested in learning more about the different kinds of plants growing in different areas of the state she lives in. The researcher creates an app that allows residents of the town to photograph plants in their area using a smartphone and record date, time, and location of the photograph. Afterwards the researcher will analyze the data to try to determine where different kinds of plants grow in the state.
Which of the following does this situation best demonstrate?
Citizen science
Crowdfunding
Open data
Machine Learning
A town decides to publicize data it has collected about electricity usage around the city. The data is freely available for all to use and analyze in the hopes that it is possible to identify more efficient energy usage strategies.
Which of the following does this situation best demonstrate?
Citizen science
Crowdfunding
Open data
Machine Learning

