
NEW
Font size
 Worksheets
Analyzing Graphs Test 5.7
Total questions: 12
Worksheet time: 3hrs 0mins

How many more male employees were there than female employees in 2004?
150
200
50
25

How much Sweet Bread did Nest Bakery sell on Friday and Saturday combined?
150
420
350
390
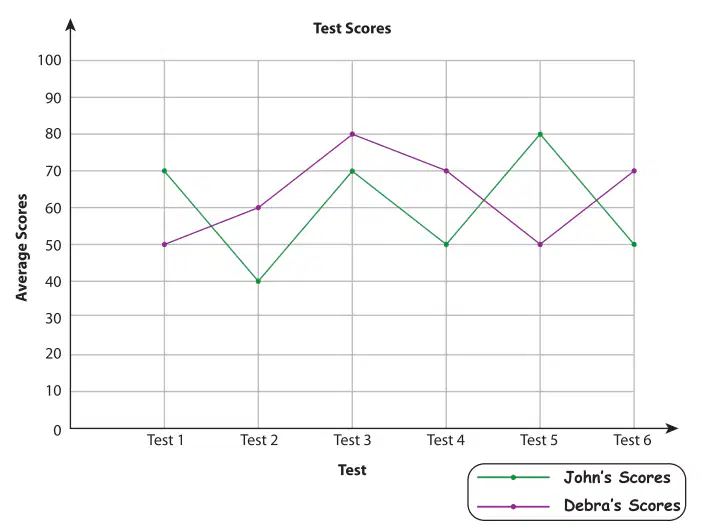
What test did John score 30 points better on than Debra?
5
2
3
6
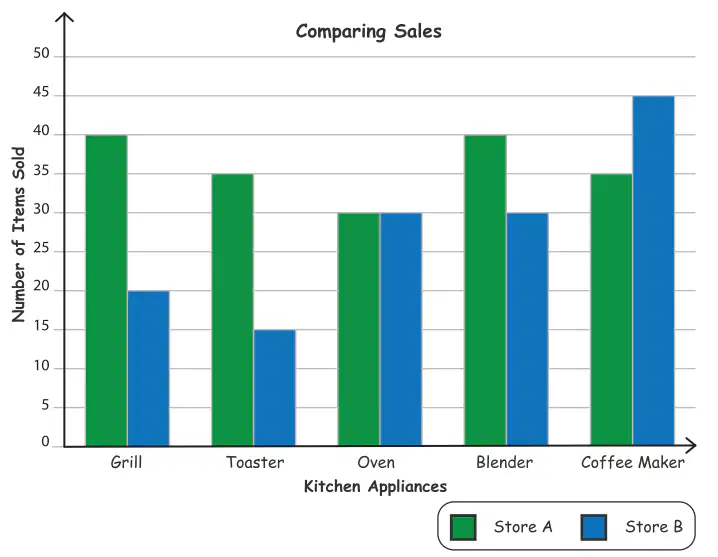
What item sold the least for Store A?
Oven
Toaster
Blender
Coffee Maker
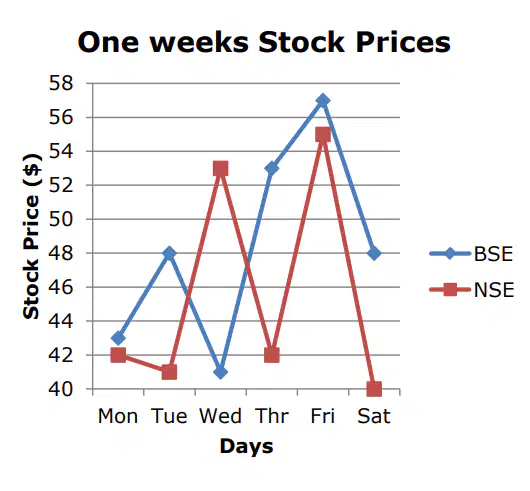
What was the BSE stock on Thursday?
51
53
55
57
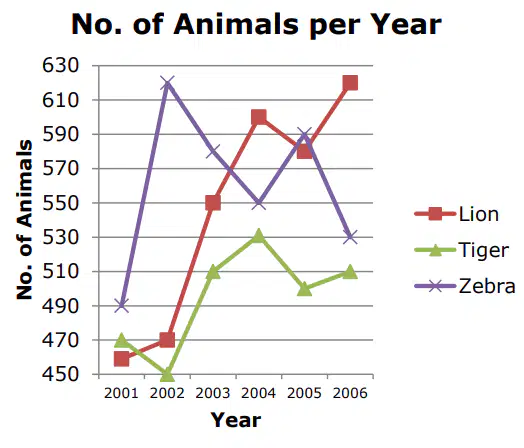
From 2001 to 2002 how many Zebras were gained?
100
160
130
95
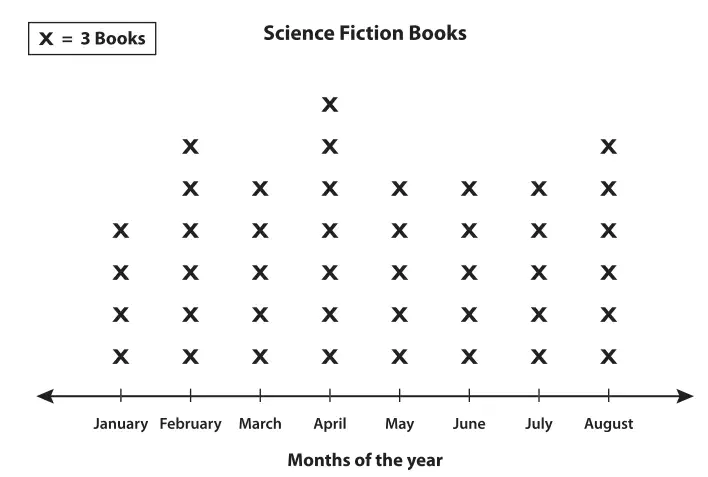
How many books were read during March and April combined?
24
30
36
12
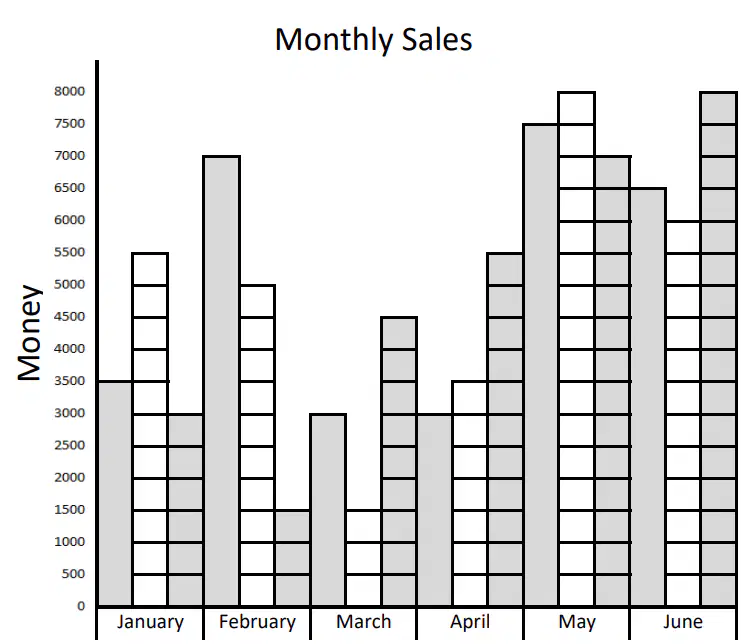
What was the least amount an employee did in sales in one month?
4000
500
1500
3000
What was the average sales in the month of January for all 3 employees?
4000
5000
1500
3000
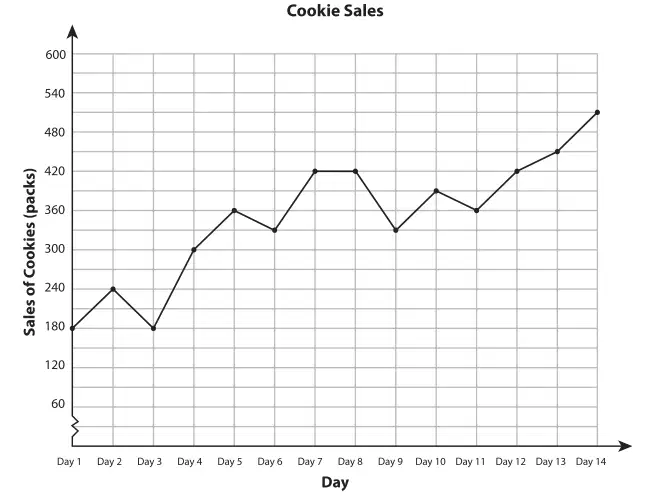
How many cookies were sold on days 4, 5, 7, and 8 together?
4000
500
1500
1800

What was the average temperature in the summer months (June, July, and August)?
91.2
90
95
275
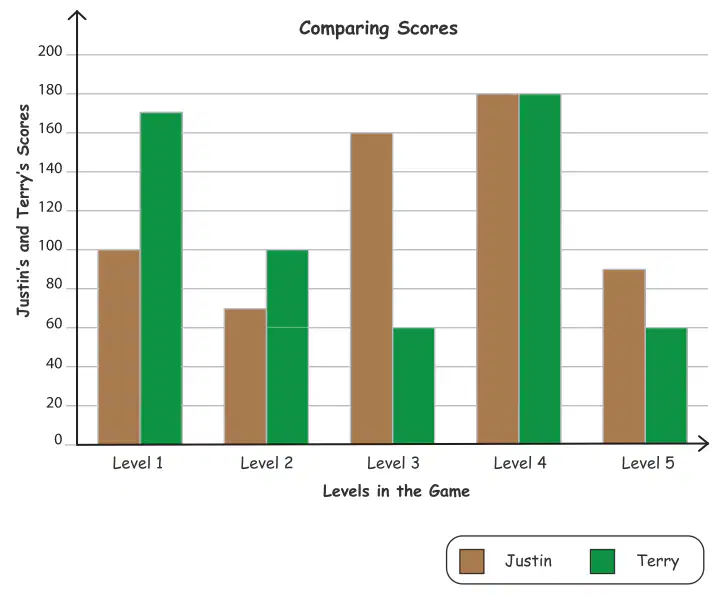
How much higher of a score did Terry have that Justin on Level 1?
50
90
70
60

