
 Worksheets
APHuGs Unit 1 Diagnostic Quiz
Total questions: 16
Worksheet time: 8mins
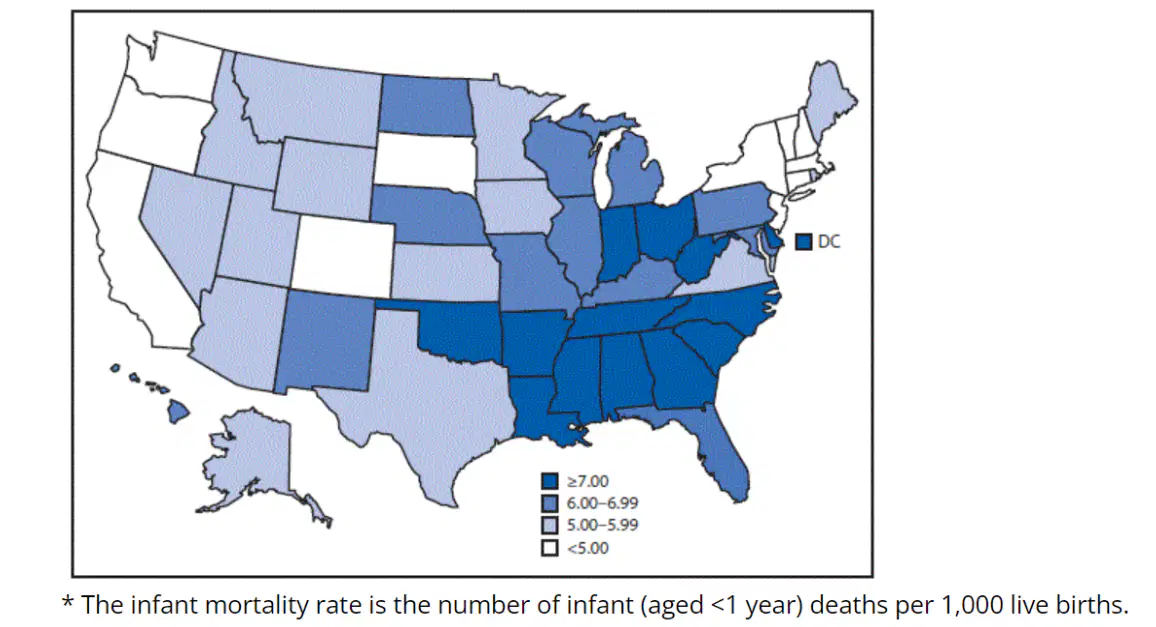
(Click image to enlarge) The map above is provided by the Center for Disease Control (CDC) shows infant mortality rate in the United States for 2016. Which of the following statements best describes the map above?
The dot density map shows a larger amount of maternal deaths (MMR )in the southeastern United States.
The choropleth map shows a lack of access to prenatal and postnatal care in the southeastern United States.
The graduated symbol map shows greater access to prenatal care and postnatal care in the western coastal region of the United States.
The isoline map shows a greater amount of child mortality (CMR) in the Southwestern United States.
The cartogram map shows fewer infant deaths in the northeastern United States.

(click image to enlarge) Which of the following statements best explains the spatial patterns seen in the map above?
Hispanic/Latino populations are evenly distributed throughout southeastern Wisconsin.
The largest clustering of Hispanic/Latino populations are found near Menomonee Falls.
Hispanic/Latino populations are dispersed throughout census tracts near Milwaukee.
Hispanic/Latino populations are largely clustered on the southside of Milwaukee and near Lake Michigan.
Hispanic/Latino populations are located in areas of lower elevation.
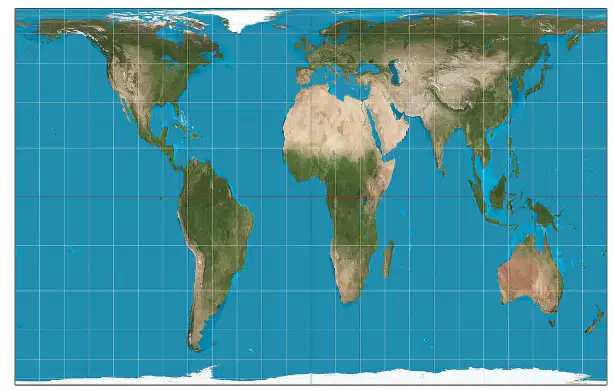
(click image to enlarge) Which map projection is most distorted at low latitudes in order to provide a more correct size but distorts shape, like in the map above?
Robinson
Goode's Equal Area
Gall-Peters
Azimuthal
Mercator

(click image to enlarge) Which of the following data sources is most likely used to create the spatial analysis shown in the table?
Property Taxes
Utility records
Home Estimates taken by housing inspectors
Census Surveys
School District Enrollment Demographic Data

(click image to enlarge) Google Earth is a geobrowser that uses satellite imagery and aerial imagery among other geographic data to represent the Earth as a three-dimensional globe. Which of the following best describes the data in the image?
A political map of the city of West Allis.
A series of overlayed geographic information system layers.
Coordinates used for navigation to the absolute location of the largest display of Wisconsin farm animals.
Choropleth of qualitative spatial information.
Remote Sensing Satellite image of the commercial and recreational land use.

(click image to enlarge) The image to the right shows a gardener's planting plans, which type of spatial information are they using?
Media report
Landscape analysis
A policy document
Photographic interpretation
Travel Narrative
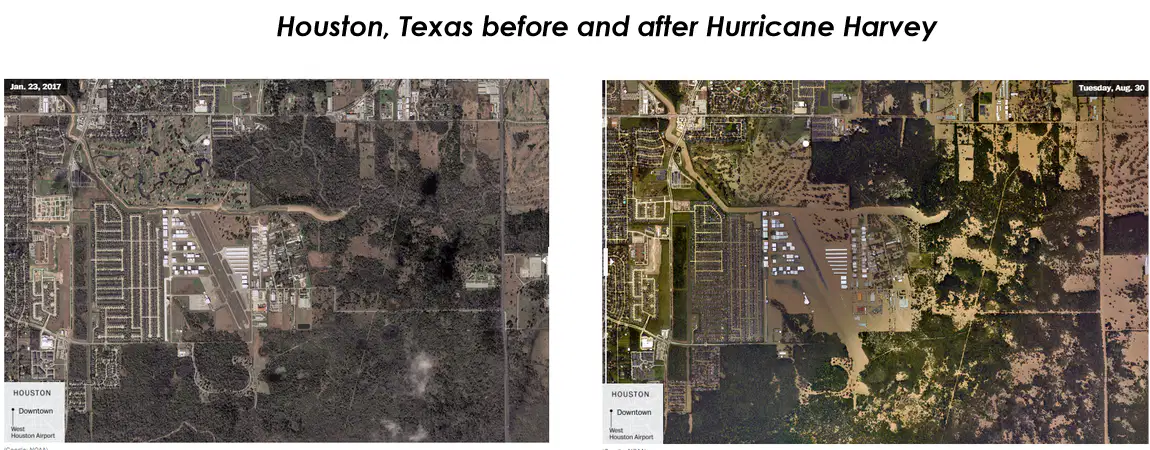
(click image to enlarge) The satellite images show changes to Houston before and after Hurricane Harvey, which of the following decisions can best be made using the spatial information found in the maps?
Federal Emergency Management Agency (FEMA) can use the information to determine which populations are most affected and will need assistance following the hurricane.
Harris County Flood Control District can use the image to determine vegetation loss and improvements to storm water drainage for future hurricanes.
State and local governments can use the image to determine total economic losses incurred.
Urban planners can use the image to determine where future developments in the city will take place.
Houston Chamber of Commerce can use the map to determine economic losses to local business and the number of insurance claims.
Which statement best describes the absolute location of Chicago, Illinois?
41.8 °N, 87.7 ° W
300 miles away from Springfield, IL
On Lake Michigan's shore
The rural center of Illinois
The capital of Illinois
Interstate Park is Wisconsin's oldest state park, established in 1900 and is located along the St. Croix National Scenic Riverway. What type of land use is best demonstrated by Interstate Park?
Agricultural
Transportation
Recreational
Commercial
Residential
Hoover Dam sought to “tame” the Colorado River bringing flood control, drinking water, and cheap hydropower, and allowed vast agricultural development in areas that were originally arid. The Hoover Dam reflects which of the following viewpoints of human-environment interaction?
Possibilism
Environmental Determinism
Ecotourism
Sustainable Development
Carry capacity
Which of the following scales would be most useful for an urban planner who is helping to design changes to a local park?
1km: 200km
1km: 600km
1km: 1,000km
1km: 5,000km
1: 10,000km
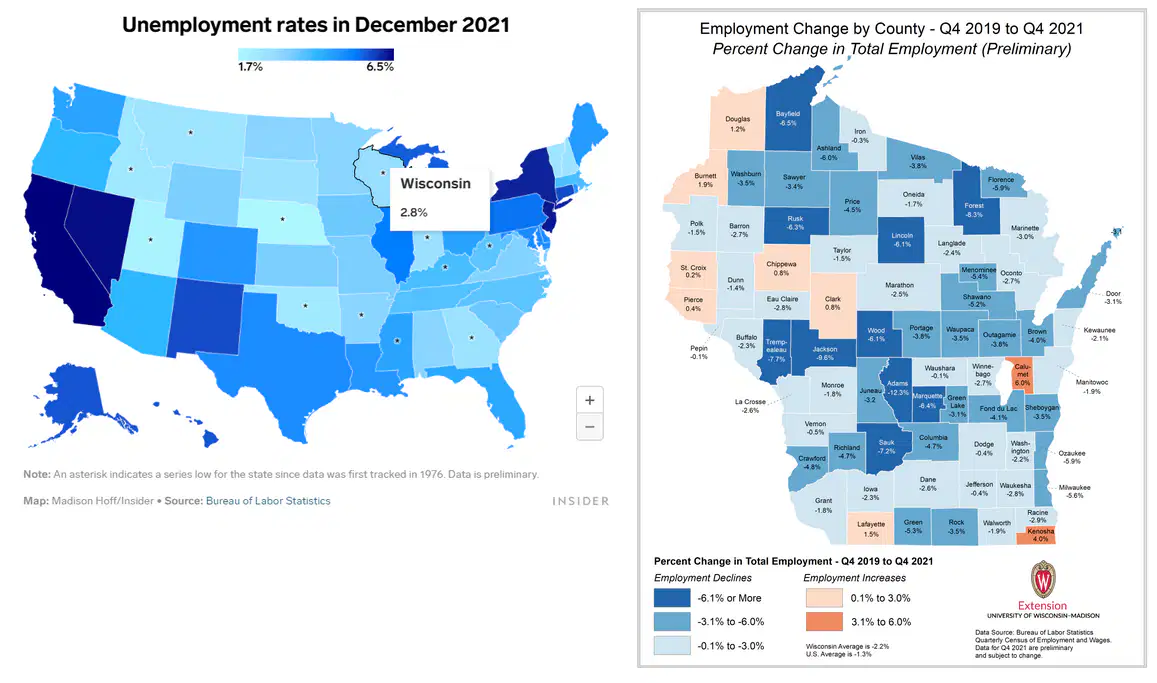
(Click image to enlarge) Based on this comparison of the two maps, which of the following statements is most accurate?
The unemployment rate for each of the counties of Wisconsin is similar to the state’s unemployment rate.
The unemployment rate for each of the counties of Wisconsin is similar to local city unemployment rates.
The unemployment rate of the state of Wisconsin reveals variation in unemployment when data is compared at various scales.
The unemployment rate of Milwaukee County is significantly lower than the state unemployment rate.
The unemployment rate of Waukesha County is significantly higher than the state unemployment rate.

(click image to enlarge) Which of the following statements best explains the reasons for the regional split between Western and Eastern Europe?
The regions have two distinct lingua francas being used along international trade lines.
The two regions share historical and political similarities resulting in centripetal force.
The two regions are split by differences in religion, political history, and levels of economic development.
The two regions are split by economic systems.
The two regions have linguistic and religious similarities fostering international cooperation.

(click image to enlarge) Based on the map, which type of region is shown?
Perceptual
Functional
Vernacular
Formal
Homogenous

(click image to enlarge) Which of the following statements best explains why countries in the southern portion of Central Asia that border the Middle East, South Asia, Europe, and East Asia are often contested or overlap with the regions mentioned.
The countries share linguistic similarities as their official languages are a reflection of Islam's influence in the region.
These regions share religious similarities with some surrounding regions, while sharing historical and political connections with other regions.
These countries share a singular ethnic identity as a result of the historical russification of the region.
These countries are part of a much larger Cold War shatterbelt regions.
These countries have linguistic differences that resulted in devolution.
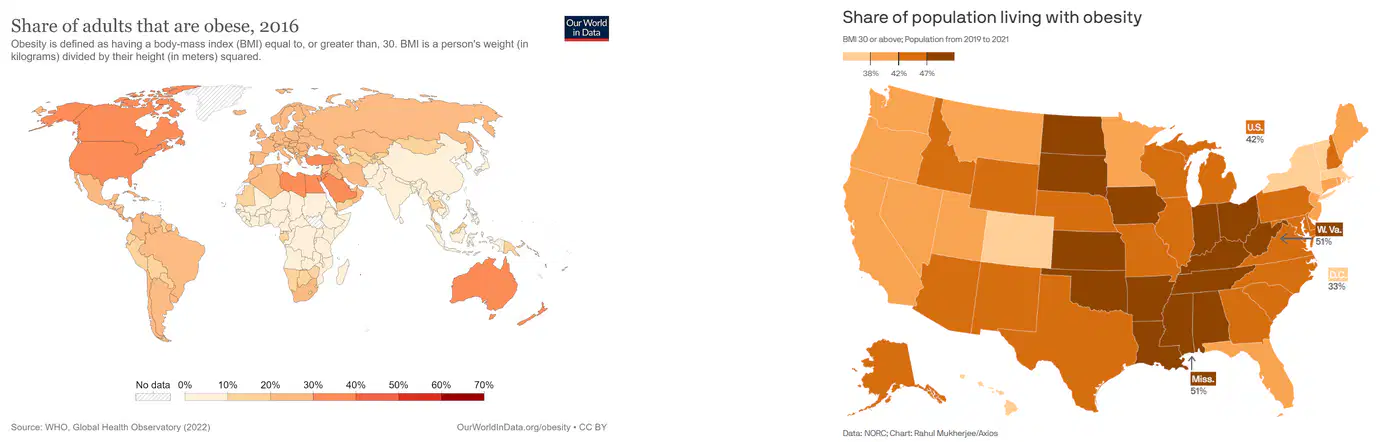
(click image to enlarge) Based on the comparison between the two maps, which statement best represents the data?
Different scales show no variation in the data for the share of Americans who are obese.
Different scales reveal that rates of obesity are higher for all sub-regions when the data is presented at the sub-national/sub-regional scale.
Different scales reveal that rates of obesity are the highest on the West Coast of the United States .
Different scales reveal that rates of obesity are highest in sub-regions located in the regions of the South and Midwest.
Different scales reveal that rates of obesity are highest in the Northeast of the US.

