
NEW
Font size
 Worksheets
HuGs Unit 2 Diagnostic Quiz
Total questions: 24
Worksheet time: 12mins

(click image to enlarge) Which generalization is best illustrated by the map?
People are spread out evenly throughout the continent.
The majority of the world’s population lives in the northern region.
More people in Central Africa than any other region.
Climate and access to water resources are the primary factors influencing population distribution.
People have preserved fertile land for farming by choosing to settle heavily in areas with poor farmland.
Which of the following best describes a country with slow population growth?
NIR/RNI of 0.9
NIR/RNI of 0.4
NIR/RNI of - 0.1
NIR/RNI of 0.10
NIR/RNI of 0
Which is most likely a bigger concern for a country in Stage 5 of the DTM?
A greater demand for government spending on pensions and healthcare for the elderly.
A greater demand for government spending on education and daycare for children.
A higher rate of unemployment among people of working age.
A higher rate of emigration by people in search of jobs.
A faster overall population growth than in previous decades.
Which of the following statements is true about the ETM?
In stage 3, people mostly die from infectious disease, accidents, and human conflict.
Diseases that affect large populations decline in stage 2 as sanitation, medicine, and nutrition improve.
Diseases like Alzheimer's and dementia start to dramatically increase in stage 3.
In stage 4, bacteria and parasites become resistant to antibiotics and vaccines.
In stage 5, people are mostly dying from accidents, animal attacks and human conflict.
Which of the following would be considered an example of a political push/pull factor in migration?
Rohingya Muslims in Myanmar have faced discrimination and violence due to their faith.
The Chinese government persecuted, arrested, and killed many Tibetans who opposed China's takeover of Tibet.
An earthquake and tsunami in Japan damaged nuclear reactors, releasing radioactive materials.
Many jobs were lost as a result of the Great Depression.
Factory workers in states like Michigan and Ohio moved to the South starting in the 1970s where new factories opened.
An earthquake in Turkey and Syria, tsunami in Indonesia, and hurricane off the coast of Florida are best explained by which of the following statements?
Natural disasters will create barriers to migration as infrastructural networks may be damaged.
Natural disasters create a political push for interregional migrants.
Economic factors may create challenges for migrants who are engaging in international migration.
Intervening opportunities pull migrants to areas that are prone to natural disasters.
Population density and land-use often determine the urgency of a government’s response to natural disasters.
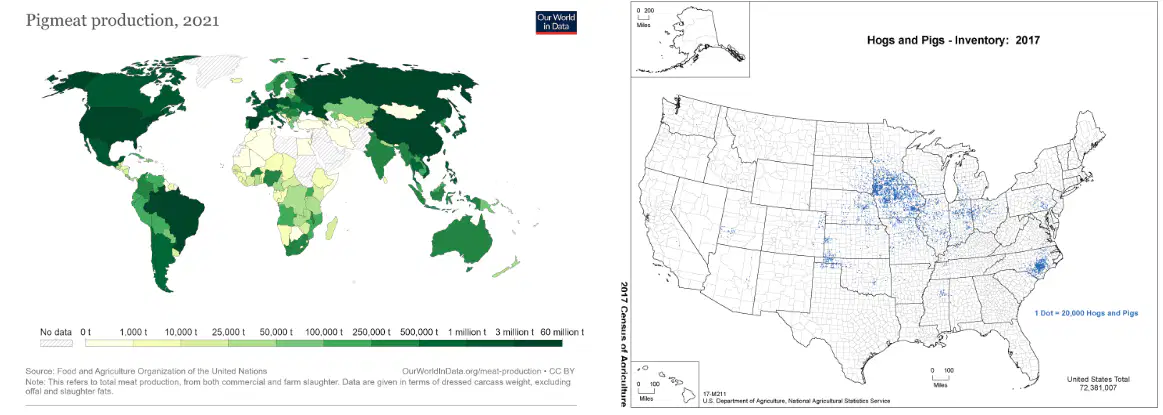
(click image to enlarge) Which of the following statements best explains the difference between the patterns of distribution seen in the maps?
Hog production is most often seen in regions that are characterized by cattle ranching.
The distribution of hog production varies when information is presented at the national scale when compared to the sub-regional scale.
There is clustering of hog production in the midwest of the United States.
The population distribution of hogs and pigs correlates to religious taboos and customs.
The distribution of hog production varies when information is presented at the Global scale when compared to the national scale.
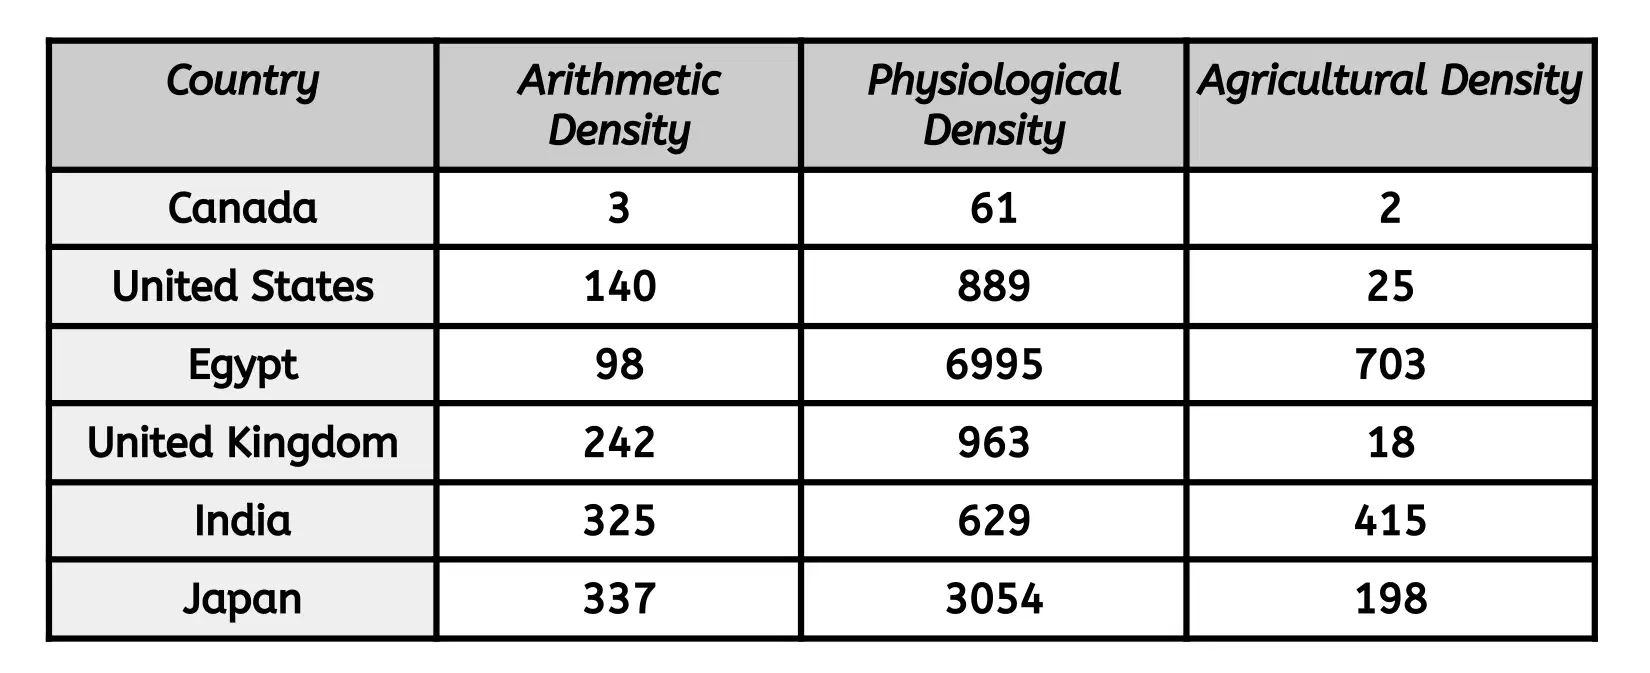
(click image to enlarge) Which of the following statements best represents the pattern found in the chart?
Farmers in the United States have access to modern technology compared to farmers in Egypt.
Japan has more total farmers per square kilometer than India.
India has more available natural resources and access to modern farming technology than the United Kingdom.
Canada has a lower carrying capacity than the United States.
The United Kingdom has more farmers per square kilometer than Japan.
(click image to enlarge) Which of the following statements best represents the pattern found in the chart?
Canada has a higher carrying capacity than the United Kingdom.
Japan has more arable land than the United States.
India has more total land area than Canada.
Egypt has the lowest carrying capacity of all countries listed.
The United States has less farmers per square mile of arable land than Canada.
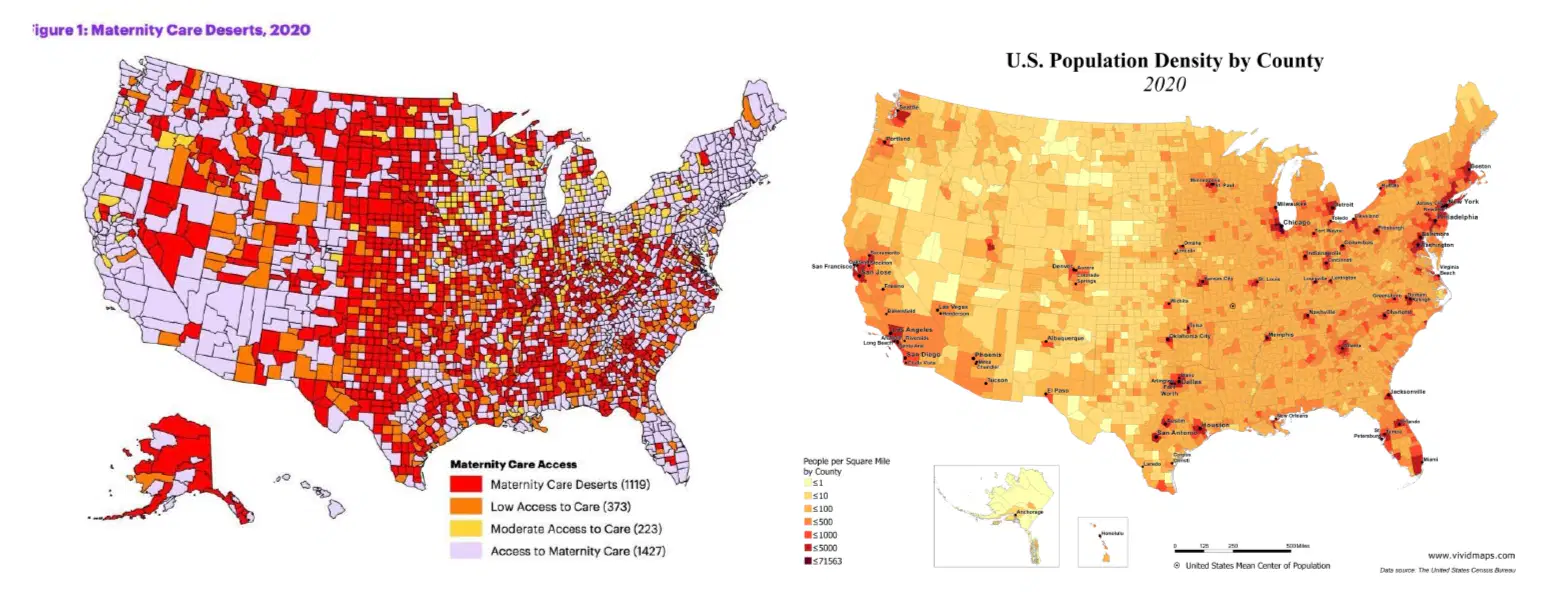
(click image to enlarge) Which of the following statements best explains the patterns of distribution seen in the maps?
Maternity Care Deserts appear more frequently in the Western United States.
Rural areas experience greater access to maternity care than urban areas.
Greater access to prenatal care can be found in urban areas than in rural areas.
The South will have access to more specialized medical hospitals than other regions.
Contraception methods are harder to get access to in the Northeast.

(click image to enlarge) Looking at the map of East Asia, what concept best describes the concern created by the strain on natural resources in population dense areas such as Shanghai and Beijing?
Carrying Capacity
Replacement Rate
Total Fertility Rate
Infant Mortality Rate
Zero Population Growth

(Click image to enlarge) Comparing Japan from 1950 to 2019, which statement is true?
The number of children 0-4 has remained stable.
The percentage of Japanese 30-50 years old has decreased.
The number of females as a percentage of the population is far greater in 2019.
The percentage of Japanese 65 and older is dramatically greater in 2019.
The Japanese population is much more stable and sustainable in 2019.

(click image to enlarge) Italy currently has a higher senior population and declining birth rates. Which of the following products or services would be utilized most often?
Video game systems and public schools.
Luxury cars and automotive shops.
Nursing homes and adult diapers.
Emergency services and skate parks.
Daycare centers and public parks.
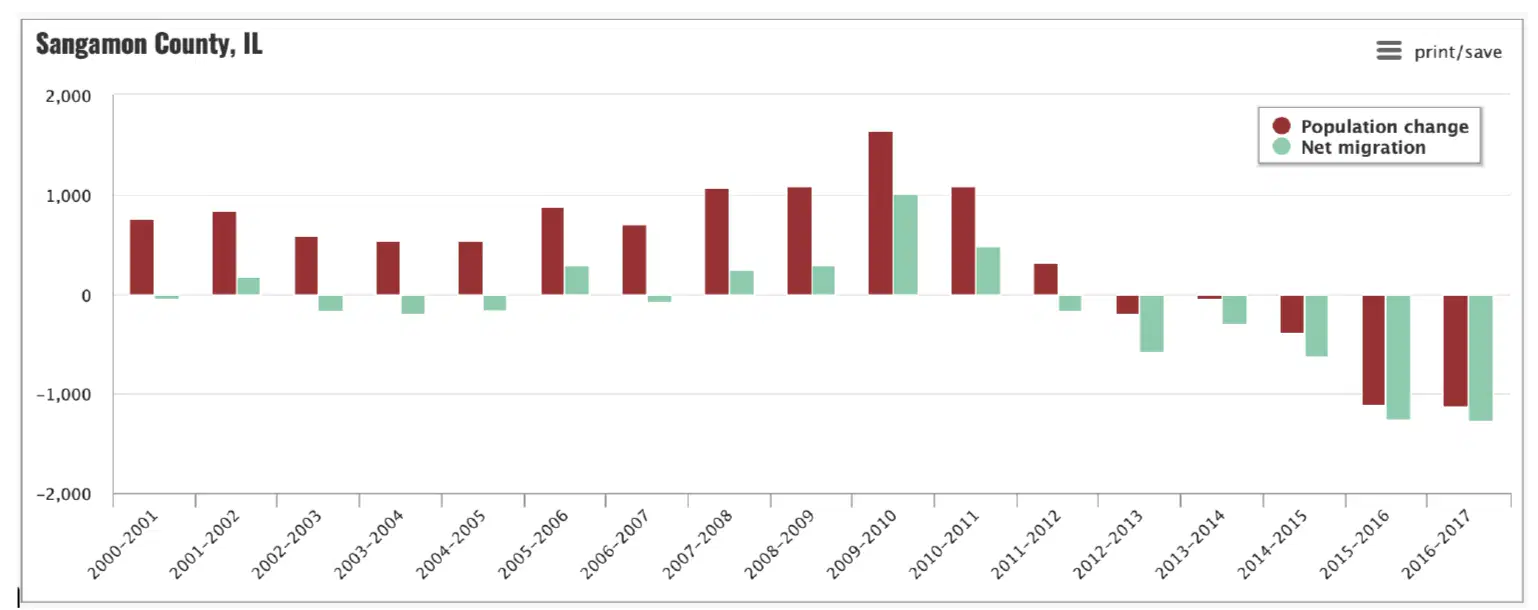
(Click image to enlarge) From 2000 to 2011 Sangamon County experienced positive population change despite having some years that featured net migration losses. What factor could have created this scenario?
Birth rates out paced death rates.
More people moved to Sangamon County during this time.
People lived longer due to better access to healthcare.
Increased economic development.
Death and birth rates both increased.

(click image to enlarge) According to the chart, what effects did the Brexit referendum have on migration?
More people entered the UK than left the UK following the EU referendum.
Immigration for educational purposes decreased significantly following the EU referendum.
Net migration remained unchanged following the EU referendum.
The number of people who were seeking British citizenship increased following the EU referendum.
Following the EU referendum immigration decreased, while emigration increased.

(click image to enlarge) Using the stimulus, what is the relationship between population and resources?
As resources increase, the population will stabilize.
As resources decrease, the population will also decrease.
As the population increases, it will outpace available resources.
As the population decreases, resources will stabilize.
There is no discernable pattern.

(click image to enlarge) In 1979, China instituted the One Child Policy. Using the stimulus, which of the following statements most accurately represents the effect of the policy on China’s population?
The policy impact can be seen in cohort 70-74 and 75-79 because of a higher crude death rate.
The policy impact can be seen in cohort 40-44 as the bars are shorter.
The policy impact can be seen in cohort 20-24 and 25-29 as people waited longer to have children.
It led to an increase in population as seen in ages 35-39.
It had little to no effect on China’s population.

(Click image to enlarge) According to the chart, how did a woman's access to education affect the number of children on average women had?
Gender inequality is higher in places where Total Fertility Rates are lower.
Women in MDCs typically have lower TFRs, whereas LDCs had higher TFRs as women obtained more years of schooling.
As women obtain more years of schooling, there is a decrease in the TFR.
As women obtain greater levels of education, crude birth rates will increase.
As women obtain greater levels of education, death rates will decrease.
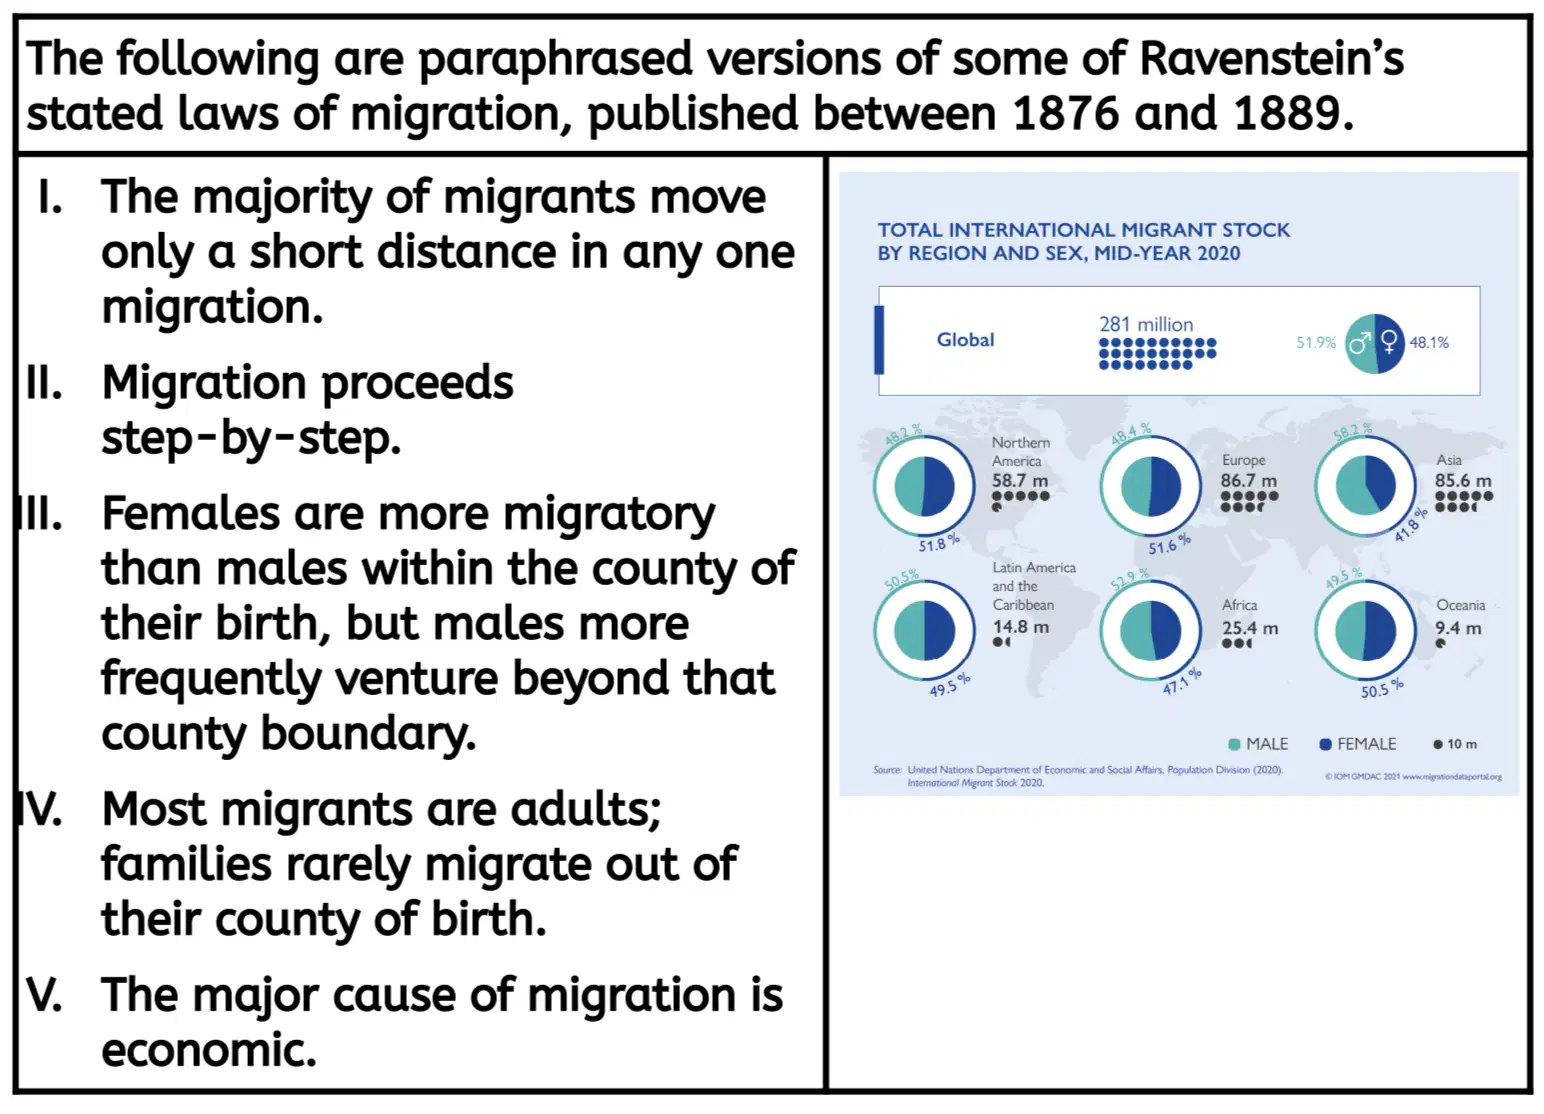
(Click image to enlarge) Which of Ravenstein’s laws are contested by the information provided in the chart?
law I only
laws I and III
laws IV and V
Law III only
None are contested
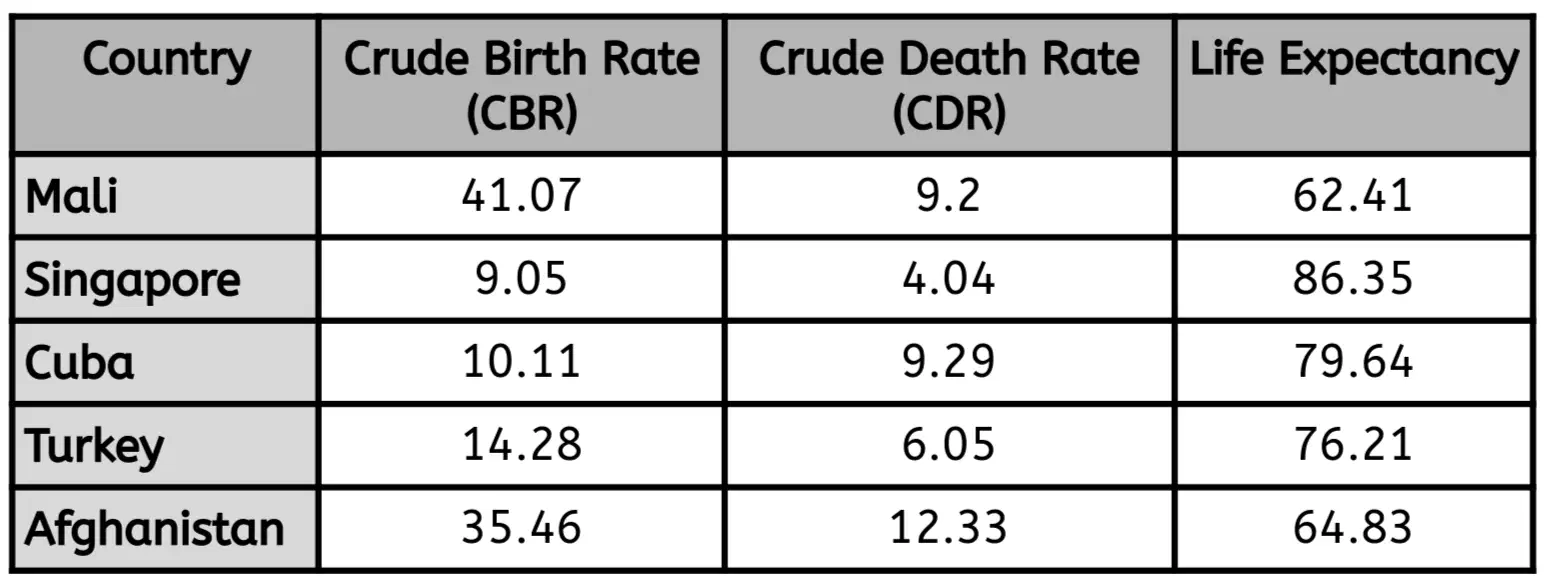
(click image to enlarge) According to the chart, which country will be the most likely to experience an aging population in the future?
Mali
Singapore
Cuba
Turkey
Afghanistan

(Click image to enlarge) Which of the following describes a concern for a country with an aging population?
As a country’s population ages, the life expectancy for the younger population of the country decreases and healthcare costs decline.
As a country’s population ages, the infant mortality rate decreases and there is an increased need for daycare centers.
As the proportion of older people in the country increases, fewer young workers are available to contribute tax revenues to support programs that provide services to the older population.
As the proportion of older people in the country increases, the sex ratio becomes disproportionally skewed toward males.
As the proportion of older people increases, the total population decreases because older people do not have children.

(Click image to enlarge) According to the chart, most refugees in the world come from three countries. Which of the following scenarios is most likely to produce these refugees?
These refugees are fleeing to economically advanced countries neighboring their home countries, in pursuit of better employment opportunities.
The refugees are Jewish people fleeing religious persecution of the Christian majority.
The refugees are fleeing civil war produced from political instability.
The refugees are forced to leave their homes because of racial segregation imposed by a theocratic government.
The refugees are fleeing the recent environmental disaster of a hurricane devastating the region.
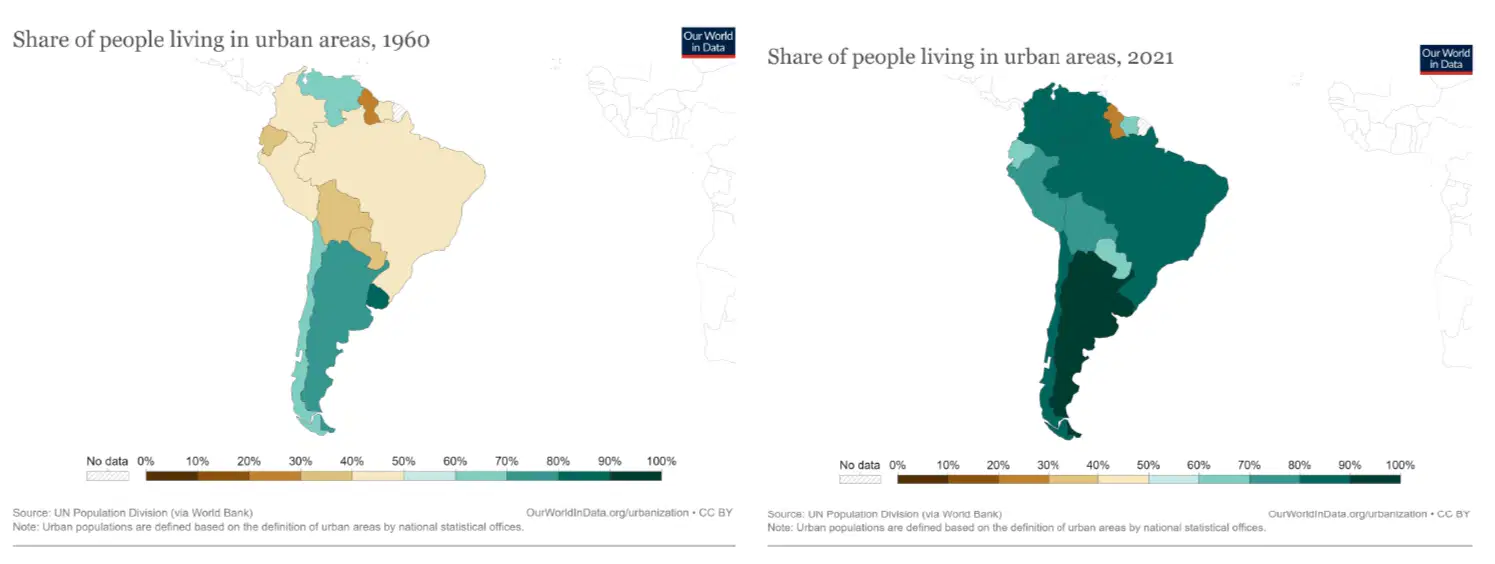
(Click image to enlarge) Which of the following statements is best supported by the data in the maps?
Increases in migration from 1960 to 2021, cities such as São Paulo and Rio de Janeiro have experienced an increase in urban sprawl.
Increases in the share of people living in urban areas between 1960 and 2021 suggests a rural to urban shift.
Decreases in the share of people living in urban areas between 1960 and 2021 suggests the occurrence of counter migration.
Increases in the share of people living in urban areas between 1960 and 2021 suggests an increase in the primary sector of the economy.
Decreases in the share of people living in urban areas between 1960 and 2021 suggests lower levels of economic development.

(Click image to enlarge) Which of the following statements best represents that data found in the map?
The map shows what countries asylum seekers are leaving and where they are going.
The map demonstrates a push factor experienced by migrants
The map demonstrates a pull factor encouraging migrants.
The map demonstrates Ravenstein’s Laws of Migration.
The map demonstrates the flow of international remittances following migration.

