
 Worksheets
Unit 8 Rate of Change and Linear Functions Quiz
Total questions: 15
Worksheet time: 8mins

What is the rate of change in the table shown below?
2/3
2
1/2
3
A linear function has a rate of change of 3. Which of the following functions below could NOT represent this function?
y = 3x + 1

y = x + 3


What is the initial value of the table shown below?
-1
1
0
-2
What is the initial value of the function y = 3x - 5?
A) 2
B) -5
C) 5
D) 0
What is the initial value of the function 3y = 2x + 12?
A) 4
B) 5
C) 12
D) 2
What is the initial value in this situation:
A catering company charges a client $75 to book an event, then $55 per hour after.
A) $55
B) $75
C) $130
D) $20

Which function matches the table shown below?
y = 3x + 6
y = -3x + 6
y = 6x + 3
y = 1/3x + 6
Which table could represent the function shown below? y=31x−2


None of the above

Which scenario is BEST represented by the graph shown?
Tom is jogging in the park. He starts off slow, then picks up speed. He stops to rest on a bench, then resumes jogging, but has to slow down again to find his lost water bottle. After finding it, he sprints towards the finish line.
Tom is jogging in the park. He maintains a steady pace throughout his jog, only stopping once at the halfway point to stretch before continuing at the same pace.
Tom is jogging in the park. He starts with a quick pace, then slows down significantly as he gets tired. He stops completely to catch his breath, then walks slowly back to the starting point.
Tom is jogging in the park. He begins his jog at a moderate pace, then gradually increases his speed throughout without stopping until he reaches the end of his route.

The graph below represents Mark's drive time on his way to work.
Mark's car is stopped at intervals 2 and 5.
Mark's car is increasing speed at intervals 2 and 4.
Mark's car is decreasing speed at intervals 1, 3, and 5.
Mark's car is driving faster in interval 4 than interval 3.
What is the equation of a line that passes through the point (3, 4) and has a slope of 3?
y = 3x + 1
y = 3x - 5
y = -3x + 4
y = 3x - 1
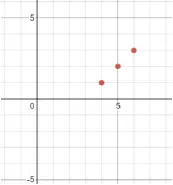
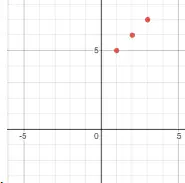
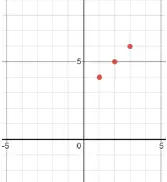
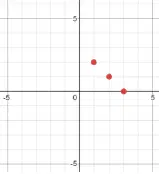
Which graph shows points that correspond to the equation y = x + 4?

Mark is a campaign coordinator tasked with increasing the online presence of a new product. He outlines a target for the number of online engagements (likes, shares, comments) the product's page should receive each day of the campaign. The targets are outlined in the table shown.
Which equation below accurately represents the number of engagements the product's page should have after x days, if Mark is achieving his target?
y = 100x + 100
y = 100x
y = 50x + 50
y = 100x - 100
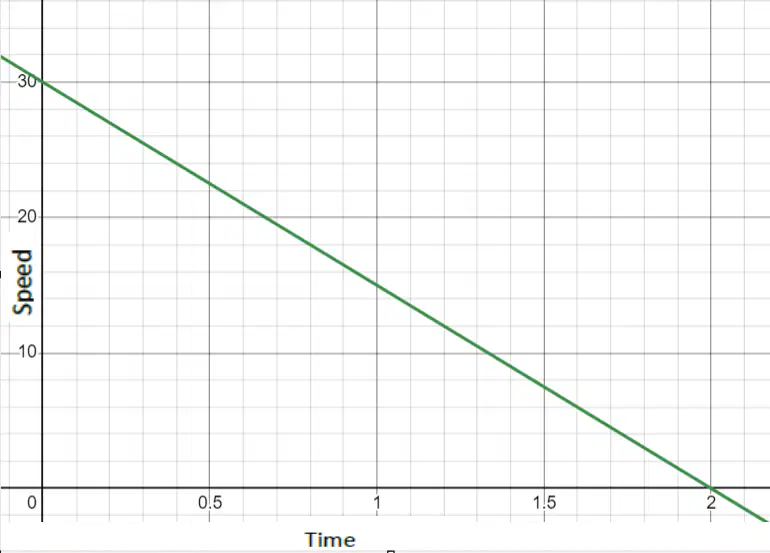
A bicycle is moving at a steady pace of 15 mph. It gradually slows down to a complete stop. The change in the bicycle's speed is represented in the graph provided. Which equation correctly represents the situation?
y=−30x+15
y=−15x+30
y=15x+30
y=30x+15

The graph shows the amount of water that is collected in a tank over the span of a week during the rainy season. What is the rate of change of the depth of the water per day?
5 inches per day
5 days per inch
10 inches per day
10 days per inch

