
NEW
Font size
 Worksheets
Data Analysis
Total questions: 10
Worksheet time: 7mins

The graph shows the total enrollment of Junior High School Students from Grade 7-10 in Public Schools around Region VII for the school year 2010-2016. Study and analyze the graph and answer the question that follow.
In what two successive school years did the enrollment increase by approximately 11, 000 students?
2010-2011 and 2011-2012
2012-2013 and 2013-2014
2013-2014 and 2014-2015
2014-2015 and 2015-2016

What was the percentage increase of the number of enrollment from 2014-2015 to 2015-2016?
2.45%
2.54%
2.13%
2.93%

What was the approximate budget allocated for Basic education facilities in billions of pesos?
25
35
45
55
These are the ages of the 10 teachers in XYZ Elementary School: 34, 25, 56, 43, 42, 61, 28, 39, 45, 43. What is the mean or average age of the teachers in XYZ Elementary School?
39.6
40.6
41.6
42.6
These are the ages of the 10 teachers in XYZ Elementary School: 34, 25, 56, 43, 42, 61, 28, 39, 45, 43. What is the modal age of the teachers in XYZ Elementary School?
None
All the given numbers
43
34
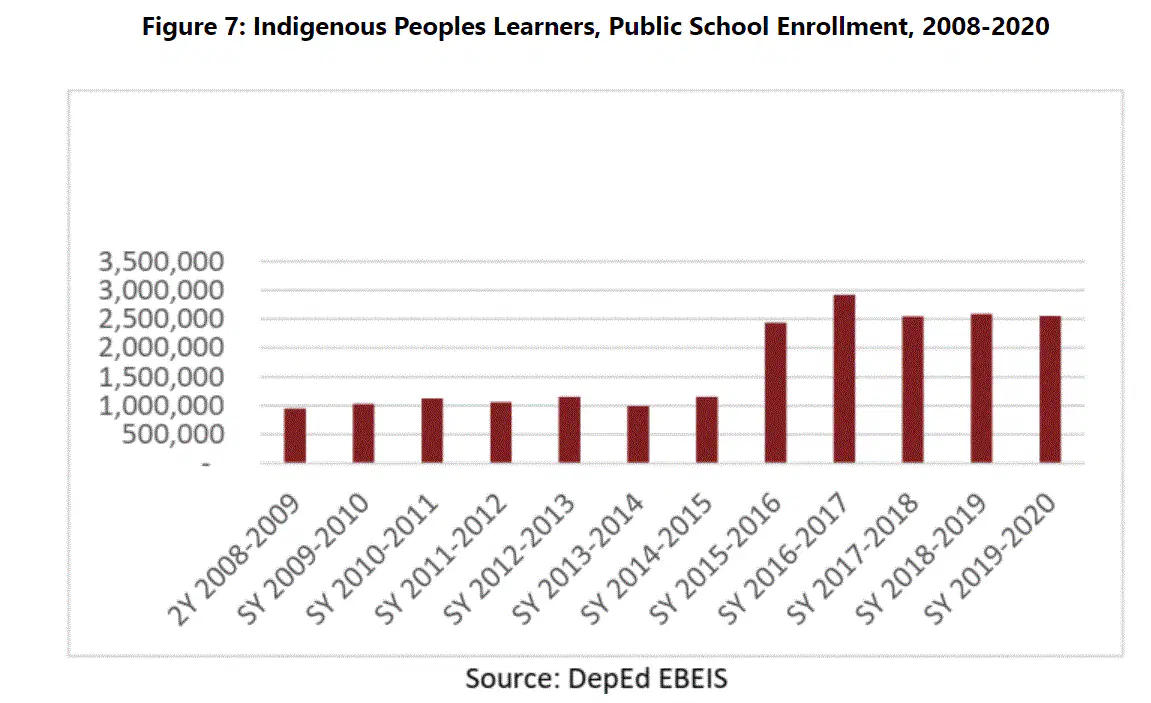
Which of the following is TRUE about the graph?
I. The IP learners’ enrollment increased from 2008-2020.
II. The IP learners’ enrollment increased from 2008-2017 then decreased during the succeeding year after.
III. There is fluctuation in the enrollment data from 2015-2016 onwards.
IV. The approximate IP Learner's enrollment for 2013-2014 is 1 million.
I, II, III, IV
III and V
III only
I and II
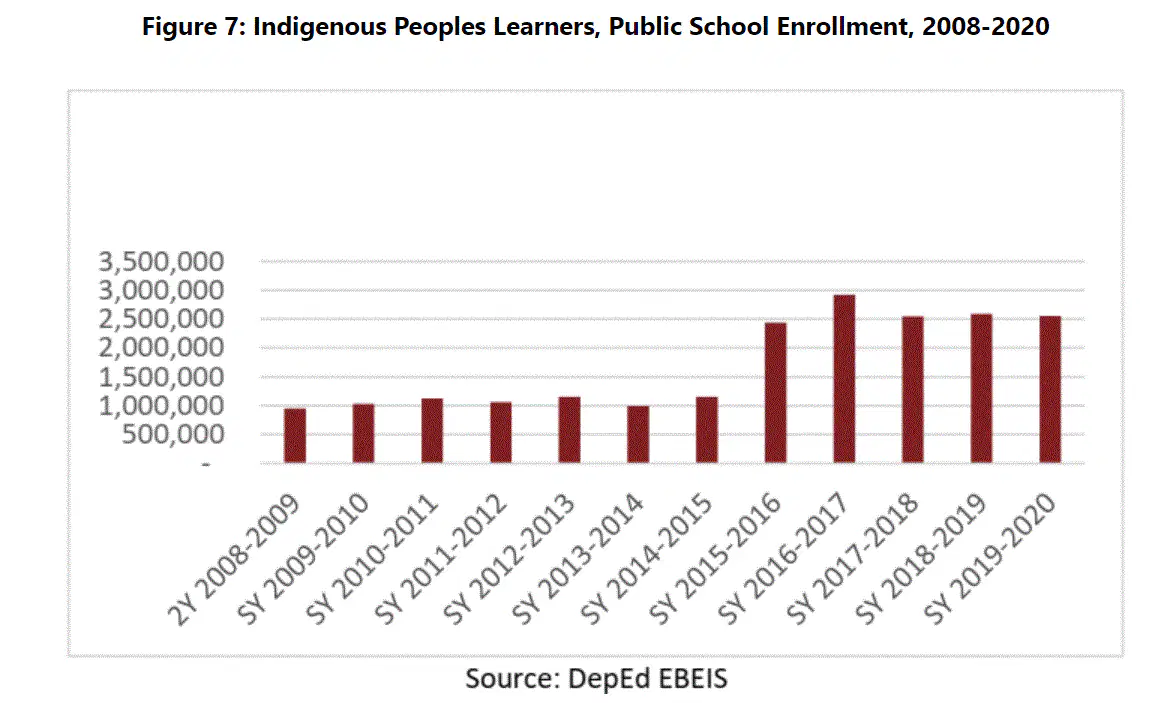
Which academic year saw an equal enrollment of IP learners?
2017-2018 and 2019-2020
2012-2013 and 2013-2014
2011-2012 and 2014-2015
2008-2009 and 2009-2010
What graph is useful to see the trend over time?
Bar Graph
Line Graph
Pie Chart
Histogram
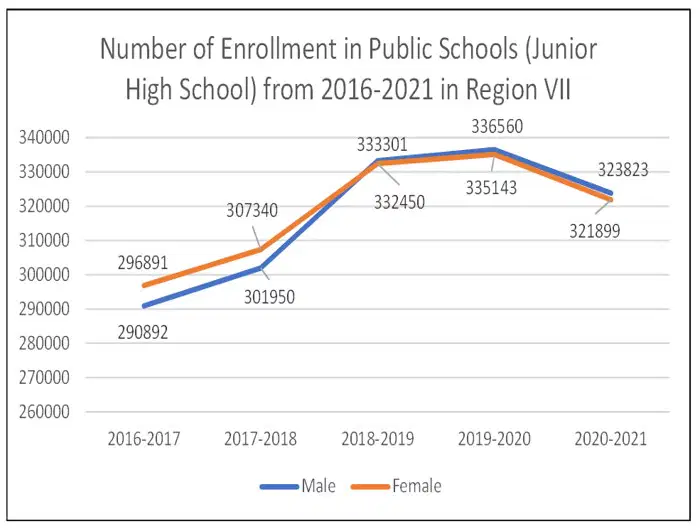
The line graph on the right shows the number of enrollment in public schools particularly Junior high school in Region VII from 2016-2021.
From school year 2016-2017 to 2018-2019, inclusive, how many female students were enrolled in the public schools (Junior High School) of Region VII?
936, 681
946, 681
956, 681
966, 681
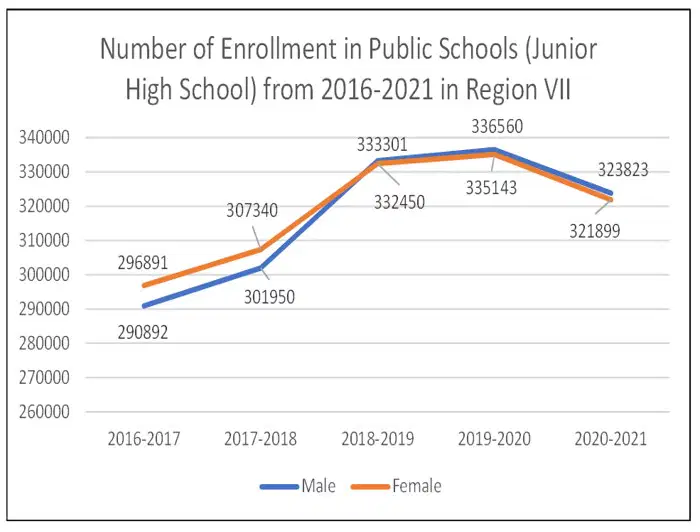
Which academic year/s did the Females enroll at a lower rate than Males for the first time?
I.2016-2017
II.2017-2018
III.2018-2019
IV.2019-2020
V.2020-2021
III, IV, V
V only
III only
I, II, III, IV

