
 Worksheets
Histograms and Linear Models
Total questions: 14
Worksheet time: 7mins
Name
Class
Date
1.
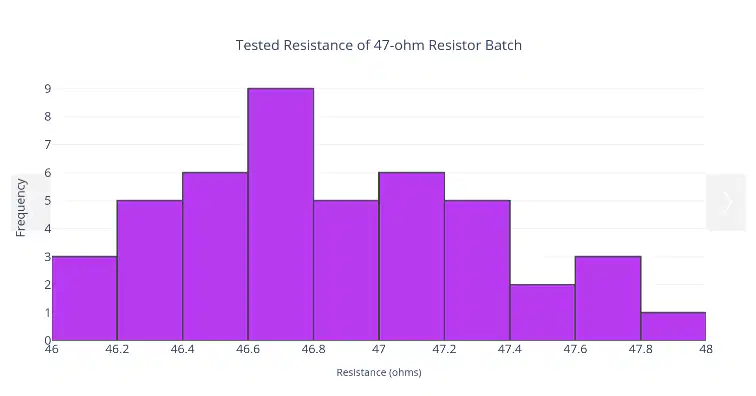
What is the number of intervals for the histogram below?
a)
.2
b)
5
c)
10
d)
15
e)
48
2.

What is the bin size of the following histogram?
a)
5
b)
48
c)
.4
d)
.8
3.
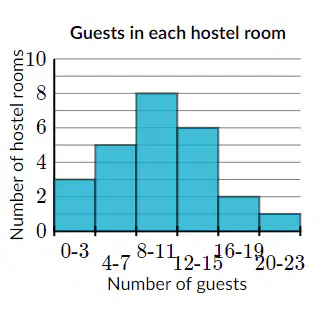
How many hostel rooms have 11 or fewer guests?
a)
15
b)
8
c)
13
d)
16
e)
6
4.
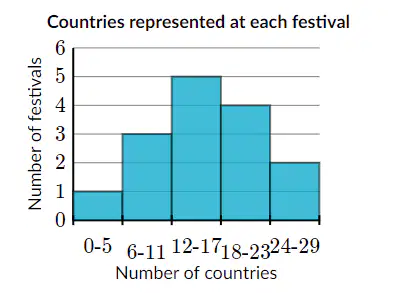
How many more festivals had 18-23 countries represented than 0-5 countries represented?
a)
4
b)
3
c)
1
d)
2
e)
5
5.
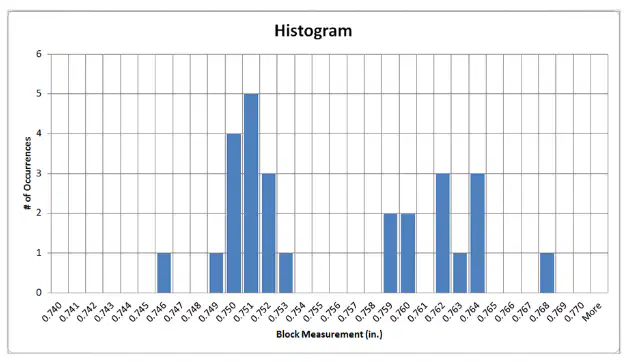
What percentage of blocks fall between .7485 in and .7575 in?
a)
55.55%
b)
59.25%
c)
51.85%
d)
53.70%
6.

A technician measures the mass in grams of 10 parts as shown below. Which of the following is the best representation of this data?
a)
Option 1
b)
Option 2
c)
Option 3
d)
Option 4
7.
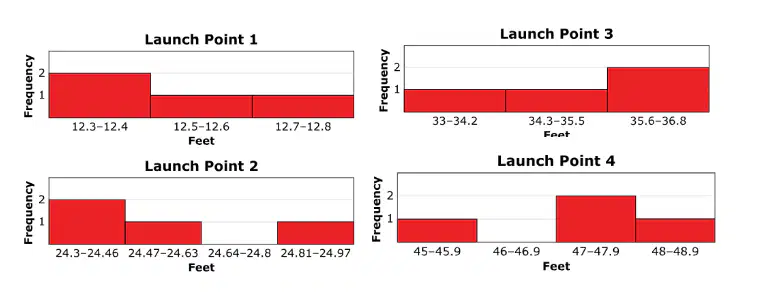
Students construct a launcher and collect data for the distances at four different launch points. They organize the data for each launch point into a histogram as shown below. Which distribution shape describes the data set?
a)
Bimodal
b)
Symmetrical
c)
Positively skewed
d)
Negatively skewed
8.

Based on the data for Launch Point 2, what is the mean in feet?
Round to the nearest tenth.
a)
18.5
b)
24.5
c)
24.6
d)
98.1
e)
12. 5
9.
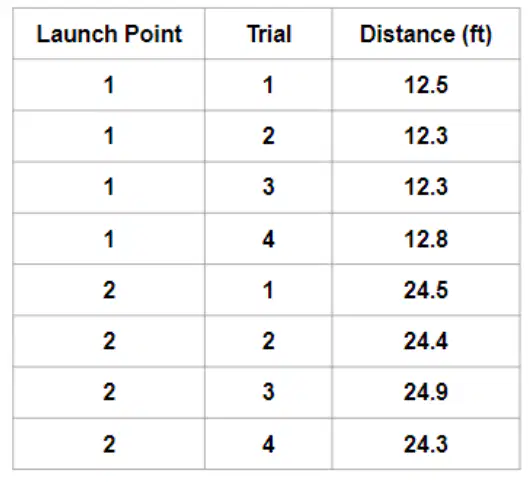
Which Launch Point has the largest range? What is the range?
a)
Launch Point 1, Range = 12.5
b)
Launch Point 2, Range = 0.6
c)
Launch Point 1, Range = 0.5
d)
Launch Point 2, Range = 12.6
10.
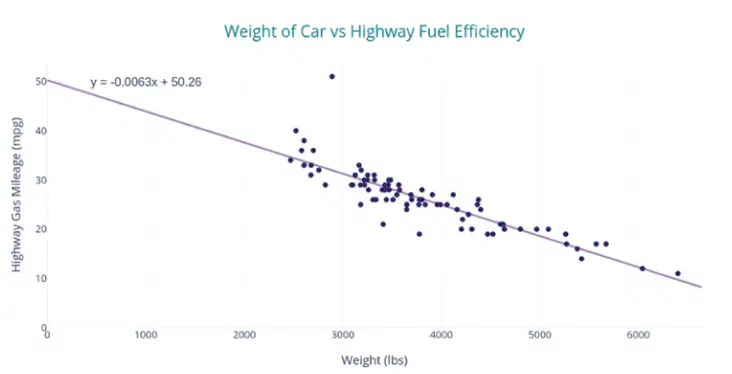
Based on the graph below, select the correct statement.
a)
As the weight of the car decreases, the gas mileage decreases.
b)
As the weight of the car increases, the gas mileage increases.
c)
As the weight of the car increases, the gas mileage decreases.
11.
The average length of time that a flashlight battery can continuously supply power, y, depends on the age of the battery, x. This relationship can be represented by the linear mathematical model:
y = 10 – 0.5x
y = the flashlight battery life (hours)
x = the age of the battery (years)
According to the equation above, brand new batteries (x = 0 years) can provide power for 10 hours of continuous flashlight use.
Which of the following is a reasonable interpretation of the slope of this linear relationship?
a)
A flashlight loses half an hour for every year of age
b)
The half-life is equal to 10
c)
The life of a battery decreases by a factor of 5
d)
The age of the battery decreases by half of a year for every hour of continuous age
12.
An engineering student plans to work a maximum of 7 hours tomorrow. The student will be making 3D CAD part files and assembly files. It takes 30 minutes to make a part file and 2 hours to make an assembly file.
x = number of part files
y = number of assembly files
Which of the following inequalities, in standard form, describes the scenario above?
a)
2x + 30y ≤ 7
b)
30x + 2y ≤ 7
c)
2x + .5y ≤ 7
d)
.5x + 2y ≤ 7
13.
A CAD operator needs to represent the size of a rectangular slot, d2, so that the size is always 75% larger than the hole diameter, d1.
Which of the following equations could correctly represent the size of the slot?
a)
d2 = 1.75 * d1
b)
d2 = 1.75 + d1
c)
d2 = .75 + d1
d)
d2 = .75 * d1
14.
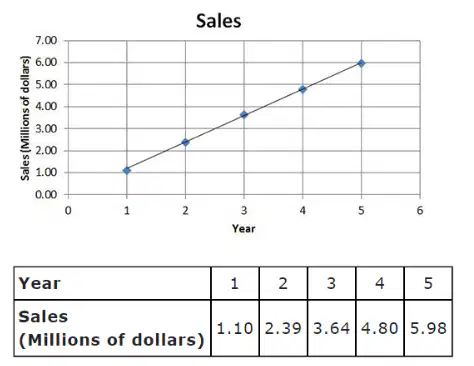
The data table shows the sales volume of a new product in millions of dollars. The graph displays the same data. If a linear mathematical model was developed for this relationship, which of the following would be the best approximation of the slope of the line?
a)
$1.02 million/year
b)
$1.20 million/year
c)
$0.98 million/year
d)
$0.82 million/year
100 %

