
 Worksheets
Semester 2 Performance Final Exam Review
Total questions: 80
Worksheet time: 1hrs 20mins

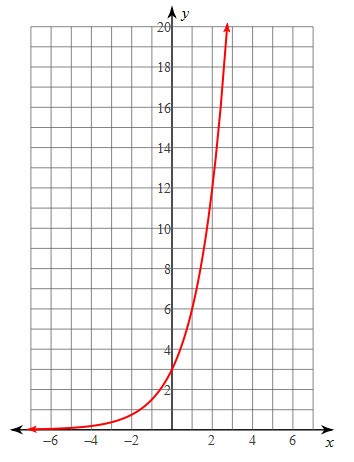
Is the pictured graph growth, decay, linear or none?


A chemist has a 100-gram sample of a radioactive material. He records the amount of radioactive material every week for 6 weeks and obtains the following data: Find the exponential model of the function. What is the rate of decay?
99%
100%
12%
88%

Greenville is having a blizzard. It has already snowed 1 inch and the total will double each hour. Write an equation for the total inch of snow in x hour.
y=1(2)x
y=1(1/2)x
y=2(1/2)x
y=2(2)x
Jamie's podcast has 1,400 subscribers. The number of her subscribers is increasing at a rate of 5.9% each week. Which function would represent her followers after w weeks?
y = 1400(1.059)w
y = 105.9(1400)w
y = 1400(1.59)w
y = 1400(5.9)w
The number of mosquitoes at the beginning of the summer was 4,000. The population of mosquitoes is expected to grow at a rate of 25% a month. How many mosquitoes will there be after 4 months?
9765
9006
5433
9766
5-3x - 1 = 25


Identify the growth factor (b-value) of the function f(x)=2(4)x.
2
4
(2)x
8

Which equation best represents the graph above?
f(x)=5(.5)x
f(x)=5(.25)x
f(x)=10(5)x
f(x)=10(.75)x

Which of the following statements about the graph above is true?
The range is the set of all real numbers less than 0.
The domain is the set of all real numbers less than 0.
The domain is the set of all real numbers greater than 0.
The range is the set of all real numbers greater than 0.

What is the transformation from y = 3x ?

What is the transformation from y = 31x ?
Which graph best represents
y=2x−4


How did the graph transform from the parent function?
y=-5(2)(x)
Down 5
Vertical Stretch by 5
Left 2
Right 2
Reflected over the x-axis
Given the original exponential function defined by y=4x, how would the graph change if the function were:
y=2(4)x-3+1?
Vertically stretched by a factor of 2, right 3, and up 1
Vertically compressed by a factor of 1/2, left 3 and down 1
Vertically compressed by a factor of 1/2, right 3, and down 1
Vertically stretched by a factor of 2, left 3, and up 1

What is the asymptote of y = 2x - 3
y = 0
y = -3
x = 0
x = -3
For y=a(b)x+k , how does adding a constant k transform the parent function?
Horizontal shift
Vertical Shift
Reflection over the x-axis
Reflection over the y-axis
Krystal was given $3000 when she turned 2 years old. Her parents invested it at a 2% interest rate compounded annually. No deposits or withdrawals were made. Which expressions can be used to determine how much money Krystal had in the account when she turned 18?
3000(1 + 0.02)16
3000(1 - 0.02)16
3000(1 + 0.02)18
3000(1 - 0.02)18
Mario's $15,000 car depreciates in value at a rate of 19% per year. The value, V, after t years can be modeled by the function V = 15,000(0.81)t. Which function is equivalent to the original function?
V = 15,000(0.9)9t
V = 15,000(0.9)2t
V = 15,000(0.9)t/9
V = 15,000(0.9)t/2
Suppose you are saving for a new skateboard. You currently have $10 that you put in an envelope to save. Each week you put $5 in that envelope. If this were to be written as a function, how would 10 and 5 be represented?
10 would be the slope; 5 would be the y-intercept
10 would be the y-intercept; 5 would be the slope
15 would be the y-intercept
15 would be the slope

Does this graph have a maximum or a minimum value?
Maximum
Minimum
What type of graph is represented by the following equation.
y = x2 + 4x - 12
Linear
Quadratic
Exponential
None of these


Is the table Linear, Exponential, Quadratic, or not a function at all?
Linear
Exponential
Quadratic
Not a function
A(n) _________________ function will ADD the same number each time.
Linear
Quadratic
Exponential
All of the above
A(n) _________________ function will MULTIPLY the same number each time.
Linear
Quadratic
Exponential
All of the above
In the first year of an annual 5K run there were 120 participants. In the 2nd and 3rd year of the 5K run, there were 180 and 270 participants respectively. This situation is best modeled by a(n) ________________ function.
Linear
Quadratic
Exponential
None of the above
Maggie is knitting blankets for the residents of a local nursing home. She already has 6 blankets completed. After one week, Kay has 8 blankets. After two weeks, Kay has 10 blankets. Kay's scenario is best represented by a _______________ function.
Linear
Quadratic
Exponential
None of the above

How should this function be classified?
Linear
Exponential
Quadratic
None of the above
True or False: All increasing exponential functions eventually exceed all increasing linear functions.
True
False

The largest number minus the smallest number

Find the mean age. You may want to write out the table with an extra column.
2.6
6.5
5.7
5.5
What is the median of the data below?
20 , 3 , 17 , 1 , 5
5
17
19
9.2
All of the below sets have the same mean.
Set 1-Standard Deviation=3.1
Set 2-Standard Deviation=4.9
Set 3-Standard Deviation=1.7
Set 4-Standard Deviation=3.2
Which set of data has the points closest to the mean?
{12, 13, 29, 18, 61, 35, 21}
What does this symbol represent? x
standard deviation
median
mode
mean
Which of the following best describes the process of finding the range for a set of data?
Which of the following best describes the process of finding the interquartile range for a set of data?
You must find the 5 number summary in order to make a box and whisker plot.
Which of the following lists all parts of the five number summary?

Which city has a higher median?

What is Millersburg's Q3 value?

Which city has a minimum value that is lower?

What is the median of the data?

What percentage of the data is between 90 and 140?

What percentage of the data is between 40 and 150?


The data set below has an outlier of 42.
2, 5, 12, 15, 19, 4, 6, 11, 16, 18, 12, 12, 42
What effect does removing the outlier have on the measures of center?
The median will decrease
The mean will decrease
The mean will increase
The median will increase



When using IQR to find outliers, which formula will identify the lower limit?
Q3 - 1.5(IQR)
Q1 + 1.5(IQR)
Q1 - 1.5(IQR)
Q3 + 1.5(IQR)

How many people visited different states?
3
7
6
8

How many people exercised for at least 4 hours?
2
5
0
3

How many data items are on this Dot Plot?
4
5
15
10

How many people at the bowling alley were ages 6 to 25
12
5
7
16

How many times did she practice for at least 30 minutes?
6
13
9
12

50% of the Cruisers attended between 7 and 16 car shows.
Which is the equation of the line that is parallel to the graph of y = 5x + 7 and has a y-intercept at (0, -2)?
y = 5x - 2
y = -2x + 7
y = 5(x - 2)
y = -1/5x - 2
m = 4
m = 5/8
Write the equation of a line PERPENDICULAR to the line y = 3x + 2 that passes through the point (9, -2)
y = -1/3x - 5
y = 3x-29
y = 1/3x -5
y = -1/3x +1

