
NEW
Font size
 Worksheets
Probability and Graphs
Total questions: 25
Worksheet time: 50mins


If you roll a 6-sided die, what is the probability of rolling a two?
2 out of 6
1 out of 6
1 out of 3
1 out of 5

A die is labeled with the sides below. Which number will most likely appear facing up when the die is rolled?
1
2
3
4
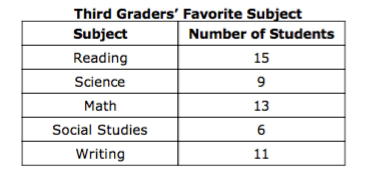
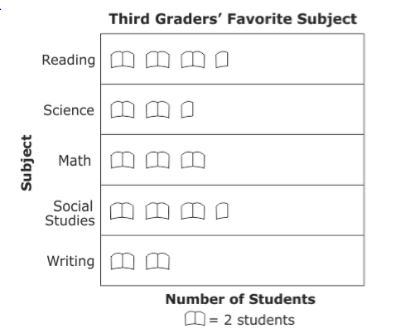
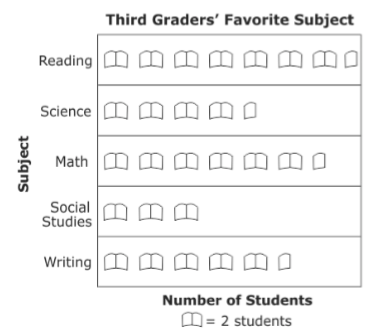
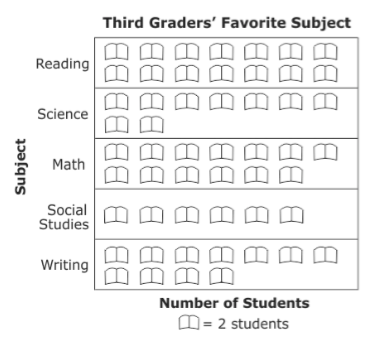
Students in 3rd grade collected data on their favorite subject and recorded it on the table shown. Which graph shows this information?


If you select a marble without looking, how likely is it that you will pick a black one?
certain
probable
unlikely
impossible


If Mariana spins this spinner, she will MOST likely land on –
orange
blue
red
yellow

Which item is impossible for Genesis to choose out of the prize box?
ball
block
candy
cupcake

What color are you MOST likely to land on?
pink
green
yellow
blue
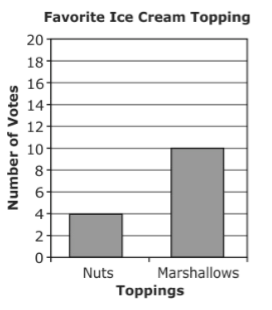
Students voted for their favorite ice cream topping. How many more students chose marshmallows than chose nuts?
4
6
10
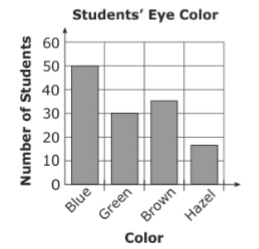
Miss Lee's science class collected data on the color of 3rd grade student's eyes. The students created a bar graph with this information. How many more students had blue eyes than green eyes?
80
50
30
20

Jack made this graph to show the number of movies that were rented from his store during four months. Which whole number shows how many more movies were rented in December than in September?
20
35
45
80

The bar graph shows the number of hamburgers sold at Bob’s Burger Shack. On which days were more than 80 hamburgers sold?
Wednesday and Friday
Tuesday and Thursday
Monday, Tuesday, and Thursday
Tuesday, Wednesday, Thursday, and Friday
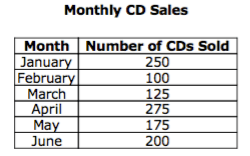
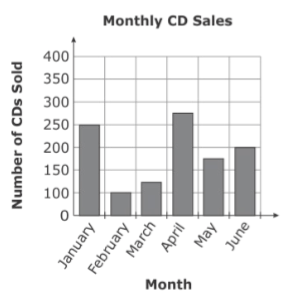
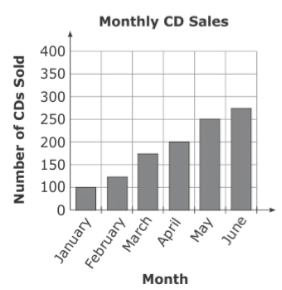
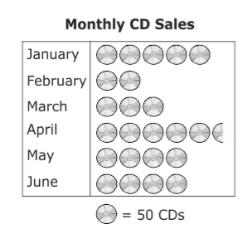
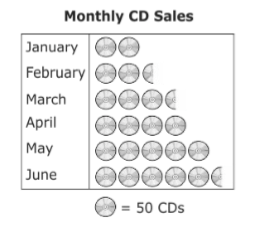
In the chart , a music store listed the number of CDs sold each month for 6 months. Which graph correctly represents the information in the chart?

Rita went bird watching. The picture graph below shows the number and types of birds she saw. Which data set was used to make this graph?




The graph shows the number of colored beads used to make a necklace. How many purple and green beads were used in all?
23
20
18
15


