
 Worksheets
Graphing quiz study guide
Total questions: 9
Worksheet time: 5mins
Name
Class
Date
1.
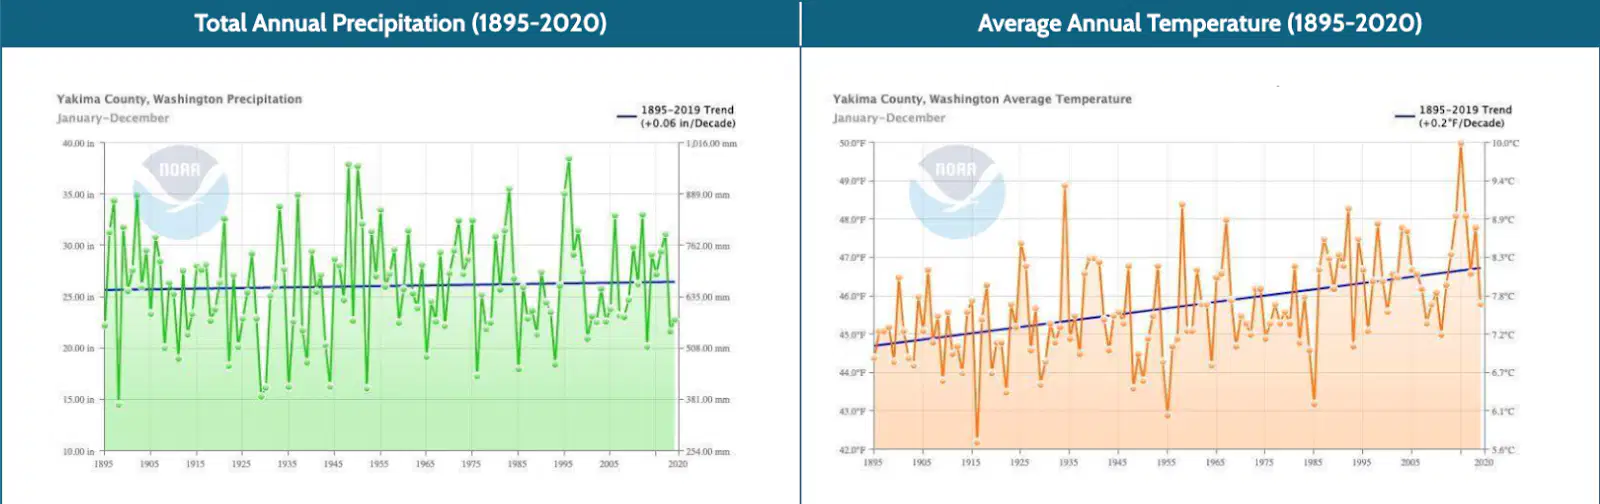
What is happening in the "total annual precipitation" graph? (the green graph)
a)
The amount of rain and snow is increasing.
b)
The amount of rain and snow is not changing.
c)
The amount of rain and snow is decreasing.
2.
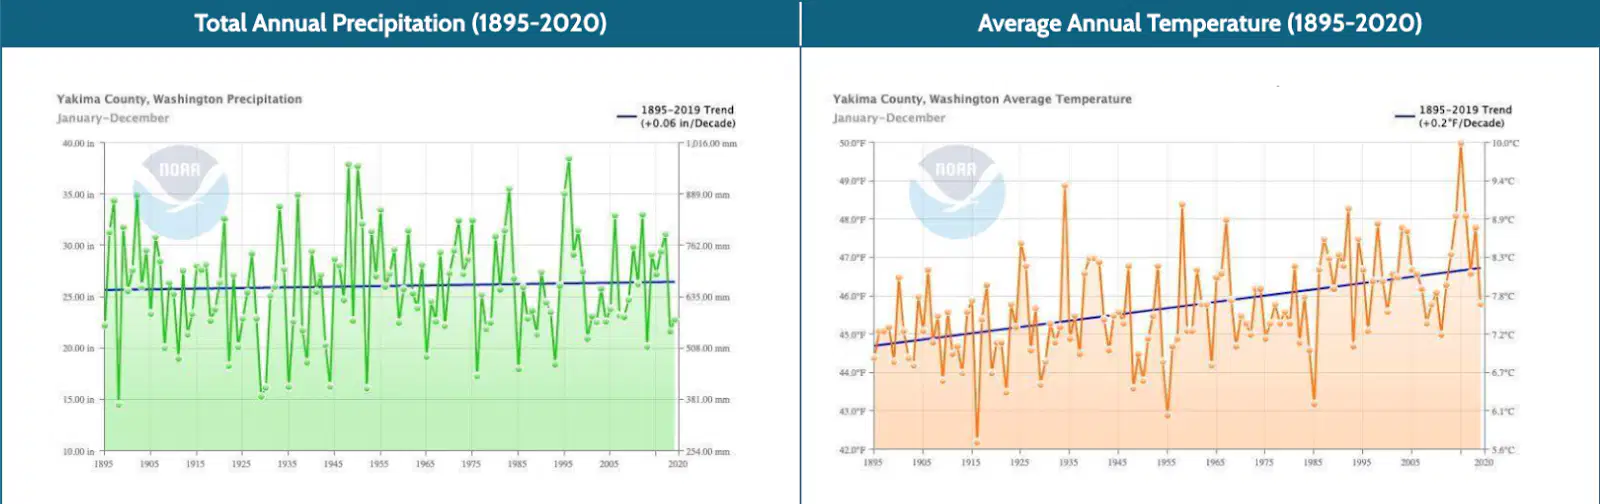
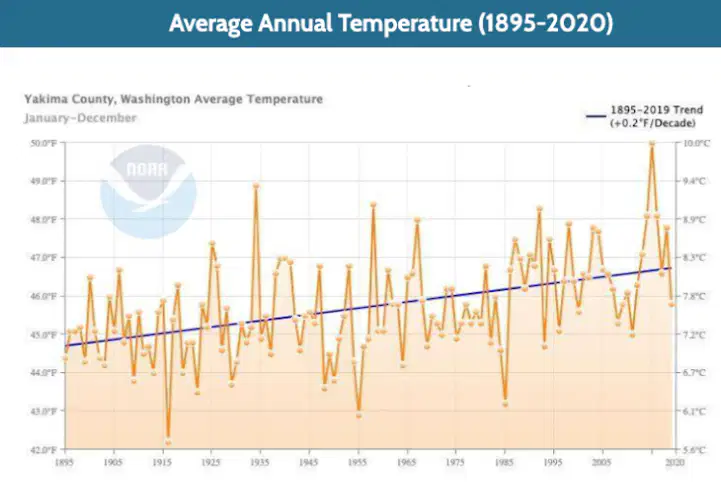
What is happening to the "average annual temperature" graph? (the yellow/orange graph)
a)
The temperature is increasing.
b)
The temperature is not changing.
c)
The temperature is decreasing.
3.
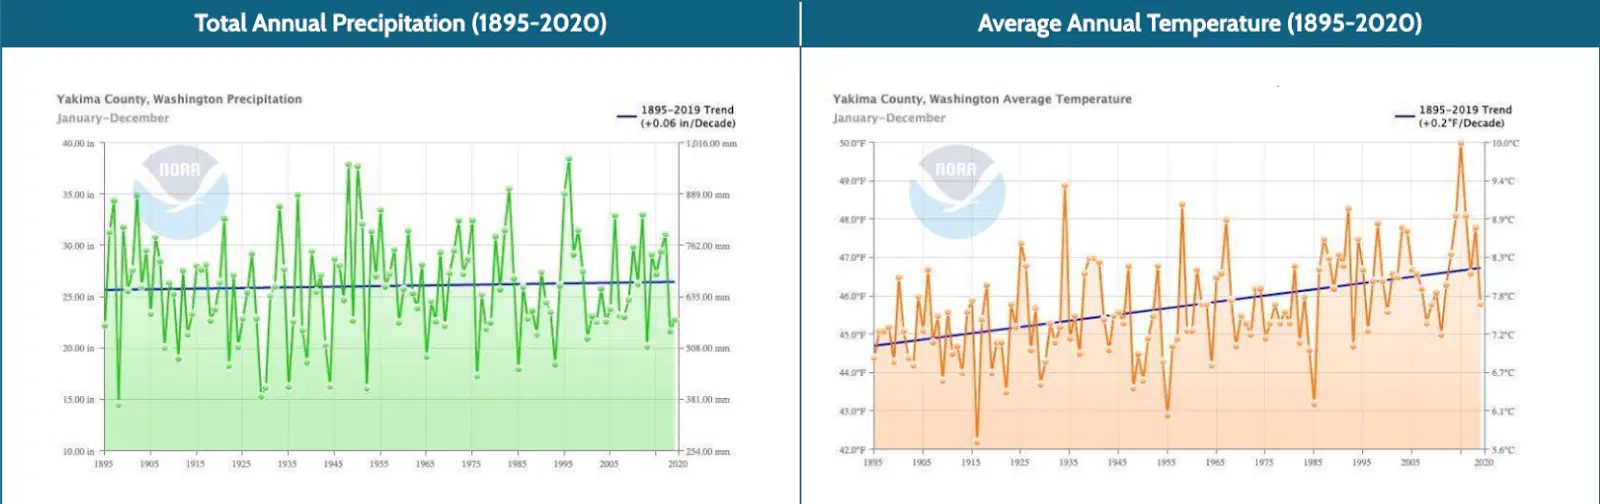
What do you think Yakima, Washington is going to experience?
a)
Droughts.
b)
Floods.
c)
Neither, it's completely normal.
4.
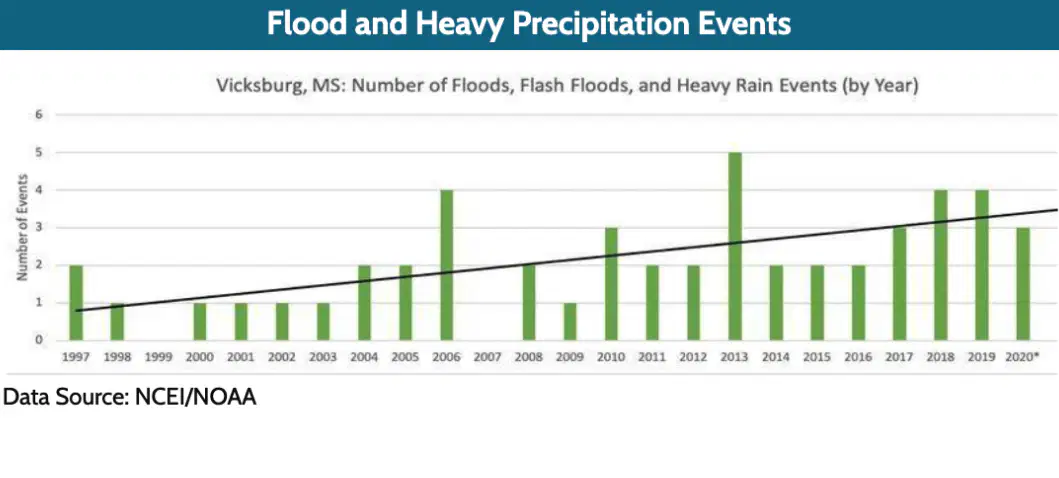
What does this graph show?
a)
No change in the number of flood and heavy storms in Vicksburg, Mississippi.
b)
A decrease in the number of flood and heavy storms in Vicksburg, Mississippi.
c)
An increase in the number of flood and heavy storms in Vicksburg, Mississippi.
5.
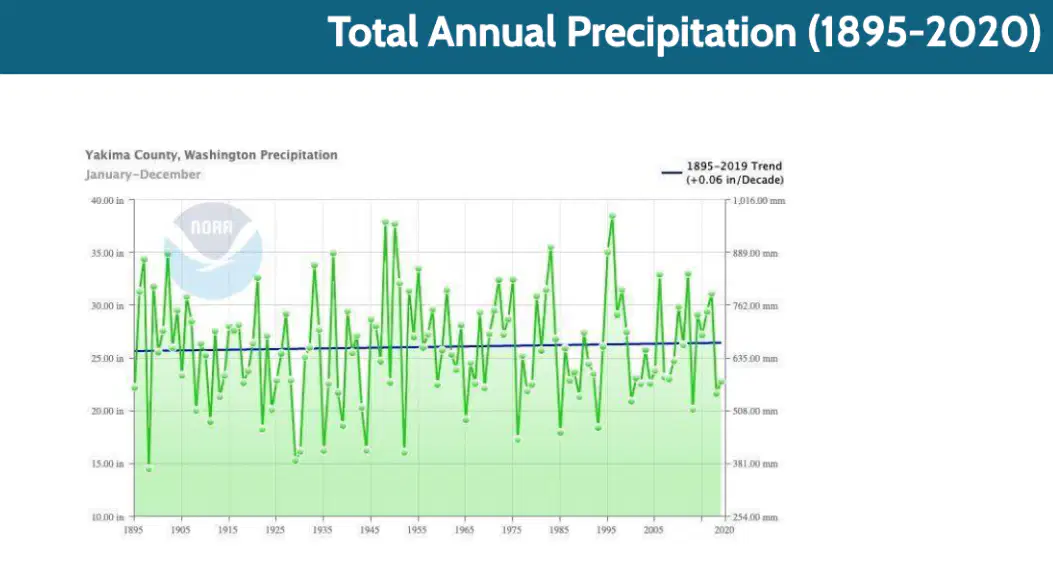
What does this graph show?
a)
No change in the amount of rain in Yakima County, Washington.
b)
A decrease in the amount of rain in Yakima County, Washington.
c)
An increase in the amount of rain in Yakima County, Washington.
6.
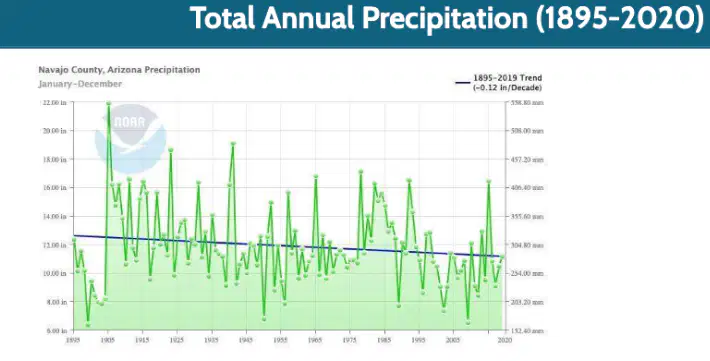
What does this graph show?
a)
No change in the amount of rain in Navajo County, Arizona.
b)
A decrease in the amount of rain in Navajo County, Arizona.
c)
An increase in the amount of rain in Navajo County, Arizona.
7.
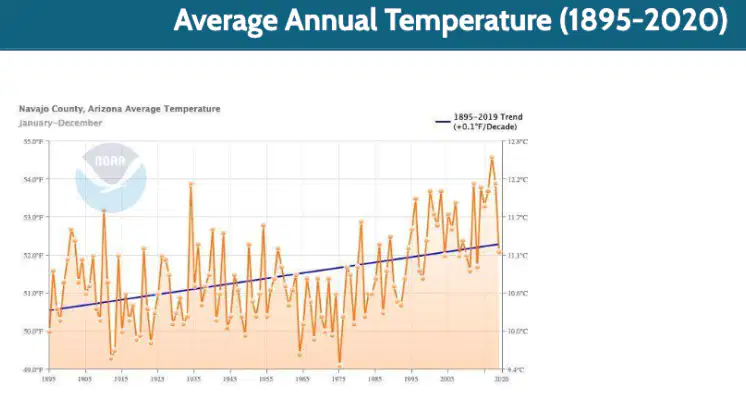
What does this graph show?
a)
No change in the temperature in Navajo County, Arizona.
b)
A decrease in the temperature in Navajo County, Arizona.
c)
An increase in the temperature in Navajo County, Arizona.
8.
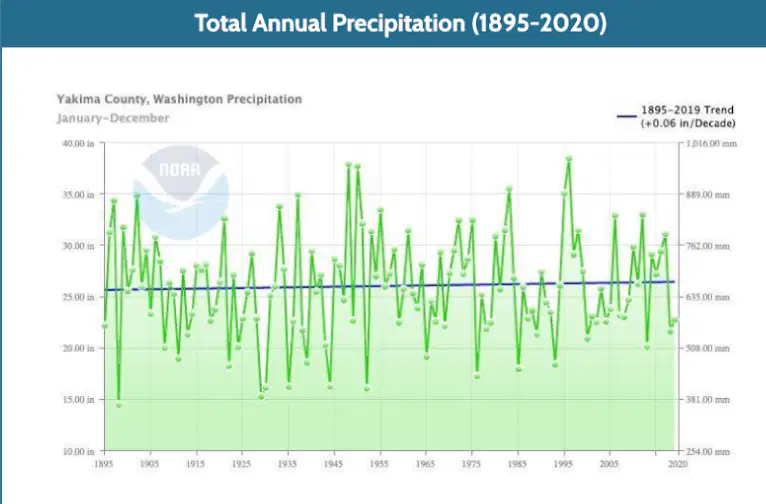
What is the name for the blue line that cuts across each of the graphs?
a)
Trendline
b)
Y-Axis
c)
Tankline
d)
X-Axis
9.
What does the trendline tell us?
a)
The trendline provides insight into the overall direction in the data.
b)
The trendline shows the highest data point
c)
The trendline represents the average of all data points
d)
The trendline predicts future values accurately
100 %

