Worksheets
Spring Semester Review: Unit 9 Data Analysis
Total questions: 60
Worksheet time: 2hrs 52mins
How do you calculate the RANGE (also called the SPREAD) of a data set?
the greatest number - the lowest number
the average number (added together, then divided by the number of dots)
The most frequent number
The middle when in order
What is the MODE of a data set?
The largest value
Values are added & the sum is divided by the total number of values in the data set
The most frequent value
The middle value when they are in order from least to greatest
What is the MEDIAN of a data set?
The largest value
Values are added & the sum is divided by the total number of values in the data set
The most frequent value
The middle value when they are in order from least to greatest

According to the histogram shown, how many parks have at least 40 trees?
26
31
17
22
List the five values of a data set used to make a box- and - whisker plot.
HINT: Together, they are called the "five- number summary" of the data.
Mean
Median
Mode
Range
Standard Deviation
Minimum
Lower Quartile
Median
Upper Quartile
Maximum
Range
Interquartile Range
Mode
Quartiles
Variance
Minimum
Maximum
Middle Quartile
Outlier
Range
How do you calculate the inter-quartile range (the IQR) of a data set?
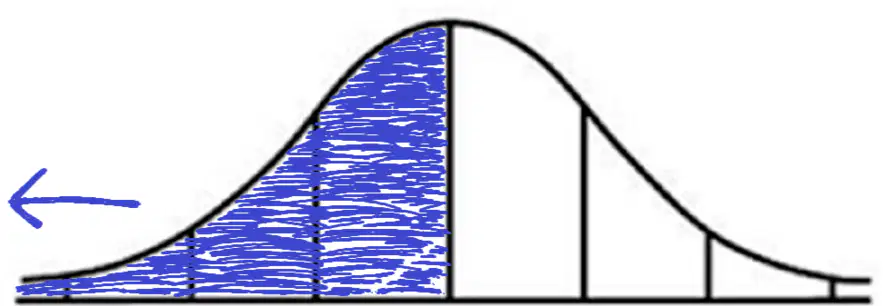
In a box- and - whisker plot, what percent of the data does the "box" represent?

According to the box plots shown, which Shop has a wider range of surfboard prices?

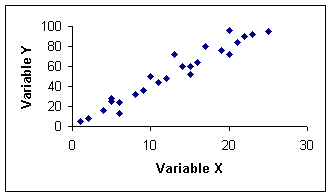
What type of correlation
does this scatterplot display?

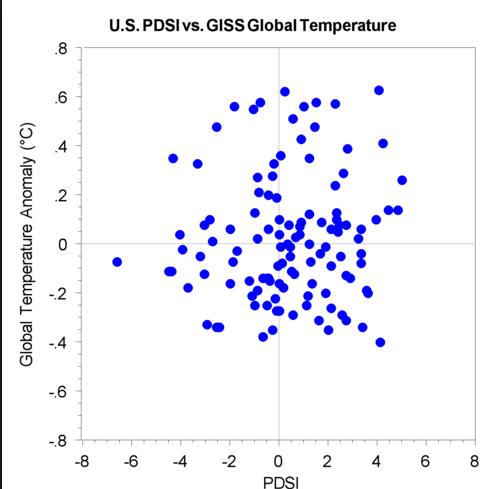
As the age of the car increases, its value decreases. Which scatterplot represents this relationship?
68%
95%
99%
50%

What does this symbol represent?
Standard Deviation
Median
Mean
IQR
The average (mean) height of women in the United States is 62 inches with a standard deviation of 2 inches. What is the height of a woman who is 1 standard deviation below the mean?
56 inches
58 inches
60 inches
64 inches
The length of time it takes a pizza from Tony’s Pizza to be delivered is normally distributed with a mean of 26 minutes and a standard deviation of 8 minutes. What is the delivery time 2 standard deviations above the mean?
34 minutes
42 minutes
50 minutes
18 minutes

What is the median shown in the box plot?
What is the term for the median of the lower half of the data?

The box below shows the number of kilowatt-hours of electricity used last month at each of the houses on Harris Street.
What is the mode of these data?
The mode score on a Geometry test is 94. Which of these interpretations must be correct?
What measure of central tendency (mean, median or mode) would be best for the following set of data?
0, 89, 92, 97, 99, 100
Mode, because it is the one that shows up the most.
Median, because there is an outlier. The outlier would influence the mean too much.
Mean, because you should always use the mean.
There is not a best measure of central tendency for this data.
What does the RANGE of a data set tell you?
How spread out the data is
Whether the data is symmetrical or not
The center of the data
Whether the data has an outlier or not

The image shown is the correct way to calculate the ___ of a data set.
Mean
Median
Mode
Range
When a data set is symmetric, which measure best describes the center?
Median
Mode
Mean
Any of them will work.
A data set can have more than one Median.
True
False
Which of the following is NOT a measure of central tendency?
Range
Mean
Median
Mode
When a data set has an outlier, which of the following measures is more reliable?
Mean
Median
What is the Range of a data set?
Average
Maximum - Minimum
the Middle Value
the value occurring the Most


The table shows the heights of six basketball
players who play for the LI Lightning.
What is the median height?
130 cm
141 cm
147 cm
159 cm
140 cm

According to the box plot, what is the maximum number of points scored by the basketball player?
A data set is shown below.
56, 64, 73, 59, 98, 65, 59
If the outlier is removed from the data set, which measure of central tendency will be least affected?
According to the box plot shown, what percentage of the heights are 62 inches or taller?
25%
50%
75%
There is no way to know without the data set.
What measure of central tendency (mean, median or mode) would be best for the following set of data?
0, 89, 92, 97, 99, 100
Mode, because it is the one that shows up the most.
Median, because there is an outlier. The outlier would influence the mean too much.
Mean, because you should always use the mean.
There is not a best measure of central tendency for this data.

What is the value of the first quartile Q1 ?
2
3
4
6

What is the value of the third quartile Q3?
3
4
6
9
Which of the following can NOT be determined when looking at a box-plot?
The median
The lowest value
The mean
The range (largest value minus the smallest value)
What does the data contained in the rectangular part (the BOX) of the box-plot represent?
the middle 50%
the lower half of the data
the upper half of the data
25% of the data
Each part of a box plot represents...
25% of the data
33% of the data
20% of the data
10% of the data

Which plot has a median of 50?
Plot 1
Plot 2
Plot 3
Plot 4

What does point C on the box plot represent?
First Quartile
Median
Third Quartile
Mean


What is the interquartile range (IQR)?
20
25
30
50

What do points B and D represent on the box plot?
Mean and Mode
Mean and Median
Least and Greatest Value
First and Third Quartiles




If 52 is the mean, what is the standard deviation on this Normal Curve?
6
12
34
18
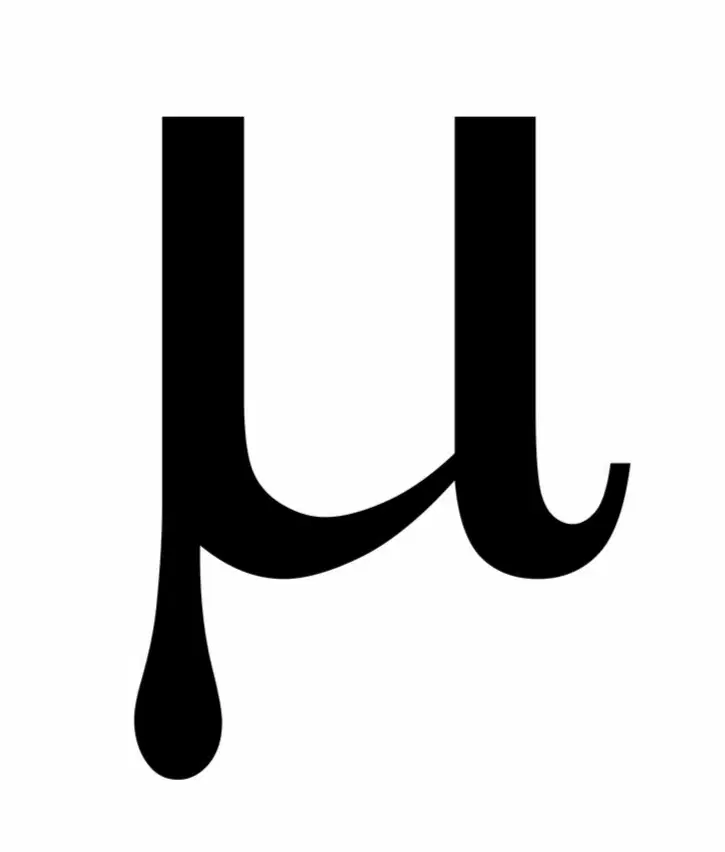
What does the symbol shown represent?
"Range"
"Variance"
"Mean"
"IQR"
The average height of women in the United States is 62 inches with a standard deviation of 2 inches. What is the height of a woman who is 3 standard deviations above the mean?
58 inches
56 inches
66 inches
68 inches
If a data set is normally distributed with a mean of 24 and a standard deviation of 3, 68% of the data will be between which two values?
15 and 33
18 and 30
12 and 36
The average (mean) height of men in the United States is 69 inches with a standard deviation of 3 inches. What is the height of a man who is 2 standard deviations above the mean?
75 inches
72 inches
69 inches
66 inches
The delivery time for a package from QuickShip Couriers is normally distributed with a mean of 45 minutes and a standard deviation of 5 minutes. What is the delivery time 1 standard deviation below the mean?
40 minutes
50 minutes
35 minutes
45 minutes