
Font size
 Worksheets
the ultimate test
Total questions: 105
Worksheet time: 3hrs 37mins
Which of the following would be an appropriate null hypothesis?
The mean of a population is equal to 50.
The mean of a sample is equal to 50.
The mean of a population is greater than 50.
None of the choices
Which of the following would be an appropriate null hypothesis?
The population proportion is less than 0.45.
The sample proportion is less than 0.45.
The population proportion is no less than 0.45
The sample proportion is no less than 0.45.
Which of the following would be an appropriate alternative hypothesis?
The mean of a population is equal o 50.
The mean of a sample is equal to 50.
The mean of a sample is greater than 50.
The mean of a sample is greater than 50.
Which of the following would be an appropriate alternative hypothesis?
The population proportion is less than 0.45
The sample proportion is less than 0.45.
The population proportion is no less than 0.45.
The sample proportion is no less than 0.45.
A Type II error is committed when
we reject a null hypothesis that is true
we don't reject a null hypothesis that is true
we reject a null hypothesis that is false
we don't reject a null hypothesis that is false
A Type I error is committed when
we reject a null hypothesis that is true
we don't reject a null hypothesis that is true
we reject a null hypothesis that is false
we don't reject a null hypothesis that is false
Suppose we wish to test H0: μ≤47 versus H1: μ>47 . What will be the result if we conclude that the mean is greater than 47 when its true value is really 52?
We have made a Type I error.
We have made a Type II error.
We have made a correct decision.
None of the choices is correct
If, as a result of a hypothesis test, we reject the null hypothesis when it is false, then we have committed
a Type II error
a Type I error
no error
an acceptance error
The owner of a local restaurant has recently surveyed a random sample of n=250 customers of the restaurant. She would now like to determine whether or not the mean age of her customers is over 30. If so, she planned to provide background music to appeal to an older crowd. If not, then no changes would be made to the background music in the restaurant. The appropriate hypotheses to test are:
H0: μ ≥30 versus H1: μ <30
H0: μ≤30 versus H1: μ >30
H0: X≥30 versus H1: X <30
H0: X ≤30 versus H1: X >30
A major telco is considering opening a new telecom centre in an area that currently does not have any such renters. The telco will open the centre if there is evidence that more that more than 5,000 of the 20,000 households in the area use the telco. It conducts a poll of 300 randomly selected households in the area and finds that 96 subscribe to the telco. State the test of interest to the rental chain.
H0: p ≤0.32 versus H1: p>0.32
H0: p ≤0.25 versus H1: p>0.25
H0: p ≤5,000 versus H1: p>5,000
H0: μ≤5,000 versus H1: μ>5,000
Suppose the P-value for a hypothesis test is 0.0304. Using a = 0.05, what is the appropriate conclusion?
a) Reject the null hypothesis
b) Reject the alternative hypothesis
c) Fail to reject the null hypothesis
d) Fail to reject the alternative hypothesis
When p-value is greater than alpha we:
Reject Ho
Fail to reject Ha
Fail to reject Ho
Reject Ha
The null and alternative hypothesis can be the same.
Yes
No
Maybe
All the above
H0: μ = k
H1: μ ≠ k
Left-tailed test
Two-tailed test
Right-tailed test
H0: μ = k
H1: μ > k
Left-tailed test
Right-tailed test
A __________ occurs if you accept the null hypothesis when it is false.
Type I error
Type II error
A __________ occurs if you reject the null hypothesis when it is true.
Type I error
Type II error
What is the 5 steps procedure for hypothesis testing?
1) State the hypotheses and identify the claim
2) Find the critical value
3) Compute the test value
4) Summarize the results
5) Make the decision (reject or not reject)
1) State the hypotheses and identify the claim
2) Compute the test value
3) Find the critical value
4) Make the decision (reject or not reject)
5) Summarize the results
1) State the hypotheses and identify the claim
2) Find the critical value
3) Compute the test value
4) Make the decision (reject or not reject)
5) Summarize the results
A manufacturer claims that his tires last at least 40,000
miles. A test on 25 tires reveals that the mean life of a tire
is 39,750 miles, with a standard deviation of 387 miles.
Test the Manufacturer’s claim at α = .01.
Reject Ho
Reject Ha
Fail to reject Ho
Fail to reject Ha
In performing a hypothesis test where the null
hypothesis is that the μ = 6.9. A random sample of 16
items is selected. The sample mean is 7.1 and the sample
standard deviation is 2.4. It can be assumed that the
population is normally distributed at α = .05.
Reject Ho
Reject Ha
Fail to reject Ho
Fail to reject Ha
A fast food outlet claims that the mean waiting time in
line is less than 1.9 minutes. A random sample of 20
customers has a mean of 1.7 minutes with a standard
deviation of 0.8 minute. If α = 0.05, test the fast food
outlet's claim using P-values.
Reject Ho
Reject Ha
Fail to reject Ho
Fail to reject Ha
A fast food outlet claims that the mean waiting time in
line is less than 3.5 minutes. A random sample of 20
customers has a mean of 3.7 minutes with a standard
deviation of 0.8 minute. If α = 0.05, test the fast food
outlet's claim.
Reject Ho
Reject Ha
Fail to reject Ho
Fail to reject Ha
The following are assumptions for ANOVA except:
Variance must be homogenous
There should be 4 or more independent groups
Data must be normally distributed
Randomly selected
What is the sum of the variation due to the differences in the sample means for the different groups?
(a)
In statistics it means “leftover variability”, that is “stuff” that the model can’t explain.
error
residual
mistake
failure
What are the assumptions of the residual or error terms of an ANOVA model?
Errors are normally distributed and variance is constant.
Variance is constant and the mean is 0.
Errors are normally distributed, the mean is zero, and the variance is constant.
The "eta' squared, under the ‘Effect Size’ option means that:
There is no relationship at all between the two variables.
The value of relations between two variables,
There is a relationship between two variables.
None of the above
What type of analysis you will use in ANOVA to determine which groups are significantly different from one another
(a)
Which one-way ANOVA statistical test to use to verify the homogeneity of variance assumption?
Welch Test
Levene's test
Holm correction
None of the above
Which one-way ANOVA statistical test to use when the homogeneity of variance assumption is violated?
Welch Test
Levene's test
Holm correction
None of the above
Which test to use to check the normality assumption of One-way ANOVA?
Bonferroni Test
QQ Plot
Shapiro-Wilk Test
Kruskal-Wallis rank sum Test
Which test to use to address violations of the normality assumption in One-way ANOVA?
Bonferroni Test
QQ Plot
Shapiro-Wilk Test
Kruskal-Wallis rank sum Test
What are the two kinds of variations with respect to the ANOVA discussion?
between-group sum of squares
within-group sum of squares
Total sum of squares
Standard deviation
Variance
It is a statistical method of testing for significant differences between three or more groups where the same participants are used in each group (or each participant is closely matched with participants in other experimental groups).
One-way repeated measures ANOVA test
One-way ANOVA test
Factorial ANOVA
None of the above
Which test to use in a one-way repeated measures to know if the variances of the differences between the conditions are equal
Mauchhly's test of Sphericity
Friedman ANOVA test
Huynh-Feldt corection
Greenhouse-Geisser correction
The following are assumptions for ANOVA except:
Variance must be homogenous
There should be 4 or more independent groups
Data must be normally distributed
Randomly selected
ANOVA testing is used for ...
Test for one mean
Test for two means
Test for three or more means
Test for independence between two variables
Determine whether the following scenario should use a one-way ANOVA test or two-way ANOVA test:
A researcher want to determine whether there is an interaction between physical activity level and gender on blood cholesterol concentration in children.
one-way ANOVA test
two-way ANOVA test
Determine whether the following scenario should use a one-way ANOVA test or two-way ANOVA test:
A group of psychiatric patients are trying three different therapies: counseling, medication and biofeedback. They want to see if one therapy is better than the others.
one-way ANOVA test
two-way ANOVA test
ANOVA stands for ...
Analysis of Variation
Analysis of Variance
Analysis of Variability
A Non-Visual Analysis
Determine whether the following scenario should use a one-way ANOVA test or two-way ANOVA test:
A nutritionist is studying the effects of diet on cholesterol in men and women. She has data which reports cholesterol levels for men and women for three different diets (low-fat low calorie, Adkins diet, Mediterranean diet).
one-way ANOVA test
two-way ANOVA test
This test is the nonparametric alternative of One-Way ANOVA often used when the level of measurement is ordinal.
Kruskal-Wallis Test
Wilcoxon Test
Mann-Whitney U Test
Binomial Test of Equality
Which is NOT Assumptions and Design Consideration for One-Way ANOVA
Normal distributed population
Independence of error
Homogeneity of viscoscity
Data scale
Given Null hypothesis H0: µ1 = µ2 = µ3 ……….. µk. What does the "K" stand for?
Number of levels
Number of row data
Number of column data
Number of variables
Given the alternative hypothesis Ha: µ1 ≠ µ2 ≠ µ3 ≠ …….. µk. Which are the correct interpretations?
The population mean is not same in all the groups
At least one group is different from another
Population means and hypothesized valueare equal
The population mean is same in all the groups
This test is used when comparing groups on two different categorical variables which focuses on the interpreting main effects and interaction effects.
One-way ANOVA
Two-way ANOVA
One-way t-Test
Two-way t-Test
In two-way ANOVA, this effect is where the factorial analysis looks for significant changes in the dependent variable as a result of two or more of the independent variables working together
Main Effect
Sub Effect
Interaction Effect
Outcome Effect
In two-way ANOVA, this effect is where the use of two-way ANOVA permits the evaluation of each independent variable’s effects on the dependent variable
Main Effect
Sub Effect
Interaction Effect
Outcome Effect
A corn farmer is interested in reducing the number of days it takes for his corn to silk. He has decided to set up a controlled experiment that manipulates the nominal variable “fertilizer,” having two categories: 1 = limestone and 2 = nitrogen. Another nominal variable is “soil type,” with two categories: 1 = silt and 2 = peat.
What is the dependent variable?
Number of Days until the corn begins to silk - Scale
Fertilizer (With categories: Limestone and Nitrogen) - Nominal
Soil Type (With categories Silt and Peat) - Nominal
A corn farmer is interested in reducing the number of days it takes for his corn to silk. He has decided to set up a controlled experiment that manipulates the nominal variable “fertilizer,” having two categories: 1 = limestone and 2 = nitrogen. Another nominal variable is “soil type,” with two categories: 1 = silt and 2 = peat.
What factorial anova best describes this scenario?
2x2 Factorial Anova
2x4 Factorial Anova
4x4 Factorial Anova
A corn farmer is interested in reducing the number of days it takes for his corn to silk. He has decided to set up a controlled experiment that manipulates the nominal variable “fertilizer,” having two categories: 1 = limestone and 2 = nitrogen. Another nominal variable is “soil type,” with two categories: 1 = silt and 2 = peat.
What factorial anova best describes this scenario?
2x2 Factorial Anova
2x4 Factorial Anova
4x4 Factorial Anova
A corn farmer is interested in reducing the number of days it takes for his corn to silk. He has decided to set up a controlled experiment that manipulates the nominal variable “fertilizer,” having two categories: 1 = limestone and 2 = nitrogen. Another nominal variable is “soil type,” with two categories: 1 = silt and 2 = peat.
What "are" the independent variables?
Number of Days until the corn begins to silk - Scale
Fertilizer (With categories: Limestone and Nitrogen) - Nominal
Soil Type (With categories Silt and Peat) - Nominal
A social media analyst whats to find out if the use of social media (low, medium, high) can affect the difference of hours of sleep per night. The analyst plans to use one-way ANOVA for this test.
What would be your independent variable?
Social Media Use (Categories: Low, Medium, High) - Nominal
Difference in Hours of Sleep per Nights (Scale)
Social Media Use (Categories: Low, Medium, High) - Scale
Difference in Hours of Sleep per Nights (Nominal)
A social media analyst whats to find out if the use of social media (low, medium, high) can affect the difference of hours of sleep per night. The analyst plans to use one-way ANOVA for this test.
What would be your dependent variable?
Social Media Use (Categories: Low, Medium, High) - Nominal
Hours of Sleep per Nights (Scale)
Social Media Use (Categories: Low, Medium, High) - Scale
Hours of Sleep per Nights (Nominal)
When determining whether any of the differences between the means are statistically significant, you will compare the p-value to your significance level to assess the null hypothesis.
Which of the following statements is true?
P-value ≤ α: The differences between some of the means are statistically significant
P-value > α: The differences between some of the means are statistically significant
P-value ≤ α: The differences between some of the means are not statistically significant

What is the expected value of a female who likes Pepsi?
10.5
11
14.5
6.3
What is the
χ2 calculated value for the following situation.
6.65
6.66
0.00991
1

If the χ2 critical value = 5.99 and the
χ2 calculated value = 7.35, what is the conclusion
Reject Ho, accept H1
Accept Ho, reject H1
there is not enough info to decide
The conclusion can only be made if we also know the p-value

What is the null hypothesis?
Injury type is independent of position played
Injury type is dependent on the position played independent
Injury type is correlated to position played.

What are the degrees of freedom for the following χ² test?
6
2
5
12
If we are testing at a 5% significance level and our p-value is 0.00453, what is the conclusion?
Accept Ho
Reject Ho
We need to know chi-squared
You cannot do this problem without a calculator
Testing at a 5% significance level, what are the correct rejection inequalities. (check all that apply)
if Xcalc2>5.99 then reject Ho
if Xcalc2<5.99 then reject Ho
if p < 0.05, then reject Ho
if p>0.05, then reject Ho

Find the chi-squared calculated value for the table.
0.486170447
1.442392006
1.45
2

Given that a student is male, what is the probability that maths is their favorite?
0.491
0.225
0.443
.508
Chi-squared tests are invalid if:
The calculated number is really large
One of the expected values is less than 5
One of the observed values is less than 5
The calculated numbers is really small
For a p-value from the calculator of 1.32355E-3 what would the conclusion be if testing at 10% significance level?
Accept Ho
Reject H1
Reject Ho
Need to know the chi-squared number

Who is this?
FDR
Herman Munster
Mitch McConnell
JFK
Dr. Phil Abucket
What is the
χ2 calculated value for the following situation.
6.65
6.66
0.00991
1
If the χ2 critical value = 5.99 and the
χ2 calculated value = 7.35, what is the conclusion
Reject Ho, accept H1
Accept Ho, reject H1
there is not enough info to decide
The conclusion can only be made if we also know the p-value
What is the null hypothesis?
Injury type is independent of position played
Injury type is dependent on the position played independent
Injury type is correlated to position played.
What are the degrees of freedom for the following χ² test?
6
2
5
12
If we are testing at a 5% significance level and our p-value is 0.00453, what is the conclusion?
Accept Ho
Reject Ho
We need to know chi-squared
You cannot do this problem without a calculator
Testing at a 5% significance level, what are the correct rejection inequalities. (check all that apply)
if Xcalc2>5.99 then reject Ho
if Xcalc2<5.99 then reject Ho
if p < 0.05, then reject Ho
if p>0.05, then reject Ho
Find the chi-squared calculated value for the table.
0.486170447
1.442392006
1.45
2
Chi-squared tests are invalid if:
The calculated number is really large
One of the expected values is less than 5
One of the observed values is less than 5
The calculated numbers is really small
For a p-value from the calculator of 1.32355E-3 what would the conclusion be if testing at 10% significance level?
Accept Ho
Reject H1
Reject Ho
Need to know the chi-squared number

What must be true about the expected values in a chi square test?
greater than or equal to 2
greater than or equal to 5
greater than or equal to 10
greater than or equal to 30
If the χ2 critical value = 5.99 and the
χ2 calculated value = 7.35, what is the conclusion
Reject Ho
Do not reject Ho
there is not enough info to decide
The conclusion can only be made if we also know the p-value

Describe the correlation in the graph shown.
A) Strong Negative
B) Strong Positive
C) Weak Negative
D) No Correlation

Estimate the correlation coefficient for this scatterplot.
A) r = 1.2
B) r = 0.89
C)r = 0
D) r = -0.89

Estimate the correlation coefficient for this scatterplot.
A) r = -0.9
B) r = 1
C) r = 0.9
D) r = -1
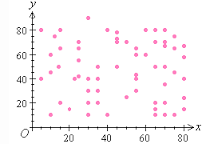
What type of correlation does this graph show?
A) Positive
B) negative
C) none
D) all of the above
As x increases, y increases
A) correlation coefficient
B) causation
C) positive correlation
D) negative correlation
Estimate the correlation coefficient for this scatterplot.
A) r = 1.2
B) r = 0.89
C)r = 0
D) r = -0.89
Estimate the correlation coefficient for this scatterplot.
A) r = 1.2
B) r = 0.89
C)r = 0
D) r = -0.89
Describe the correlation in the graph shown.
A) Strong Negative
B) Strong Positive
C) Weak Negative
D) No Correlation
Estimate the correlation coefficient for this scatterplot.
A) r = -0.9
B) r = 1
C) r = 0.9
D) r = -1
What type of correlation does this graph show?
A) Positive
B) negative
C) none
D) all of the above
As x increases, y decreases.
A) no correlation
B) negative correlation
C) correlation coefficient
D) positive correlation


