
 Worksheets
Measures of Center and Variability
Total questions: 13
Worksheet time: 21mins
Bertrand is in his school's chess club. He collects data to answer this question: How old, in months, are the members of the chess club?
Why is Bertrand's question a statistical question?
The question will have a numerical answer.
The questions can be answered by collecting data that are expected to vary.
The question will have a single answer.
The questions can be answered by collecting data that are not expected to vary.
Bea counts the number of red pencils in 7 boxes of pencils. The list shows her data: 22, 28, 30, 28, 35, 30, 28. The mean is 26 red pencils per box. Based on the MAD for the data set, would it be unlikely to get a box with 31 red pencils? Show your work. Explain your reasoning.
The MAD is 31, so it wouldn't be unlikely.
The MAD is 7, so it would be unlikely.
The MAD is 4 so it wouldn't be unlikely.
The MAD is 4 so it would be unlikely.
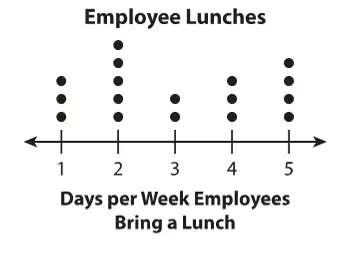
Carter collects the data shown in the dot plot to answer the question, "How many days each week do my employees bring their lunch to work?" Describe the distribution of the data Carter collected. Explain your reasoning.
The Dot Plot is nearly symmetrical, so the mean and median are nearly the same.
The Dot Plot has outliers, so we cannot describe the distribution.
The Dot Plot is skewed right because there is more data on the left.
The Dot Plot is skewed left because there is more data on the right.

A softball coach records the ages of the players trying out for her team, to the nearest 0.5 yr. The players' ages are shown. What is the 5 number summary needed to create a box plot?
Min: 9
Q1: 9.25
Median: 10.75
Q3: 12
Max 13.5
Min 9.5
Q1: 9.5
Median: 11
Q3: 11.5
Max: 13
Min: 9
Q1: 9.5
Median: 11
Q3: 12
Max 13
Min: 9.5
Q1: 9
Median: 11.5
Q3: 11.75
Max: 13
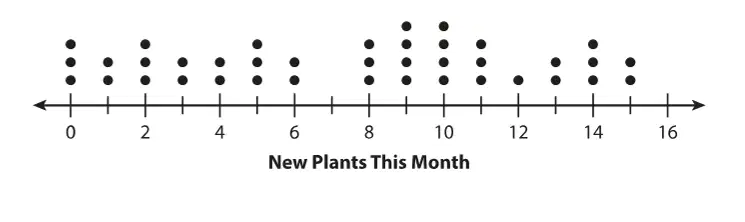
A gardening club records the number of new plants each member planted in a month. Determine the median and describe what it means in this situation.
On average, Gardening Club members planted between 0 and 15 plants each month.
Gardening club members typically planted 8 new plants each month.
The average number of plants a gardening club member planted each month was 9.5
Typically, Gardening Club members planted 7 plants each month.
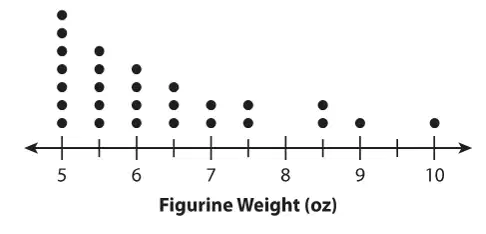
Bradley collects glass figurines. He asks this statistical question: How many ounces do the figurines in my collection weigh? He weighs the figurines and rounds to the nearest 0.5 oz. The dot plot shows his results. What does the shape of distribution on the dot plot show about the weights of the figurines? Explain your reasoning.
The distribution is skewed left so the weights of the figurines are typically from 5 to 7 ounces.
The mean weight of the figurines is 6 ounces.
There is an outlier at 10 so most figures are 10 ounces.
The distribution is skewed right so the weights of the figurines are typically from 5 to 7 ounces.

Sheila walks dogs in her neighborhood. She charges $16 per hour for dog walking and records how much money she earns each day. Determine the Median and IQR of the data.
The median is 40 and the IQR is 48.
The median is 40 and the IQR is 16.
The median is 48 and the IQR is 48.
The median is 48 and the IQR is 16.
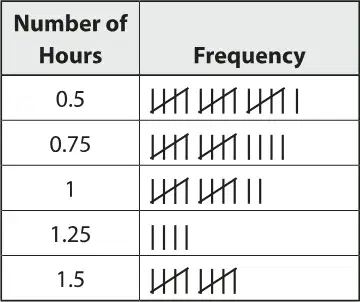
The frequency table at right uses tally marks to show the number of hours that customers spent in a restaurant during the first day of business. The owner wants to have 90 customers in the first two days of business. How many more customers does the owner need? Explain your reasoning.
(a)
Betina, Marcie, and Helena are training to complete a relay race where they each run one lap. The list shows Betina’s times, to the nearest tenth of a second, for the last 8 times she completed one lap. What is the MAD (Mean Absolute Deviation) of Betina’s times, in seconds?
65.4, 54.6, 55.7, 58.2, 53.0, 56.9, 53.5, 61.1
(a)
Marcie's mean time for completing a lap is 58.9 s with a MAD of 2.2 s. Helena's mean time is 56.6 s with a MAD of 1.9 s. Which runner has more consistent times completing the course?
(a)
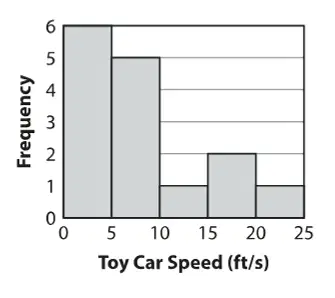
Remote-controlled toy cars compete in a series of races. The speed of each toy car is recorded, and the histogram shows the results. Is the mean toy car speed less than, approximately equal to, or greater than the median toy car speed? Explain your reasoning.
The mean is less than the median because the data is skewed right.
The mean is greater than the median because the data is skewed left.
The mean is less than the median because the data is skewed left.
The mean is greater than the median because the data is skewed right.
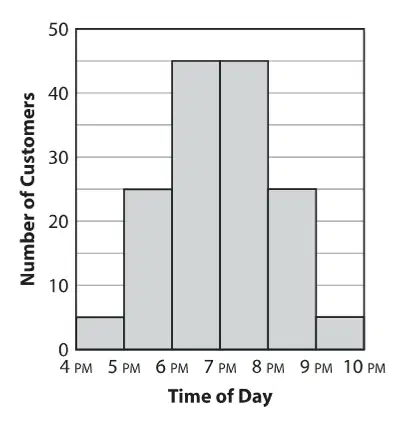
The histogram shows the number of customers at a gas station at different times of day. Which statement best describes the distribution?
A) The distribution is skewed left.
B) The distribution is skewed right.
C) The distribution contains an outlier.
D) The distribution is symmetric.
Stella surveys her coworkers to determine how many days most people worked last week. Her coworkers gave the following answers: 1, 4, 5, 3, 5, 2, 4, 5, 3, 2, 4, 5. Is this distribution symmetric? Show your work.
Yes.
No, the distribution is skewed right.
No, there are outliers in the data.
No, the distribution is skewed left.

