wayground logo

Free Printable Worksheets

NEW

Font size

S
M
L
XL
Worksheets

Final Exam

Total questions: 40

Worksheet time: 1hrs 2mins
Name
Class
Date
1.
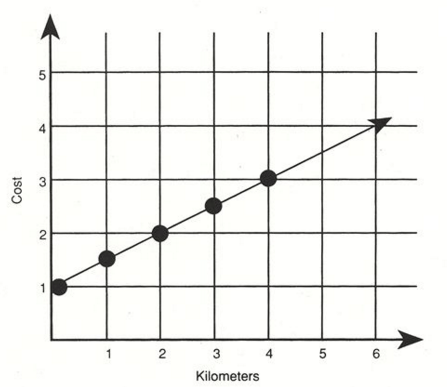
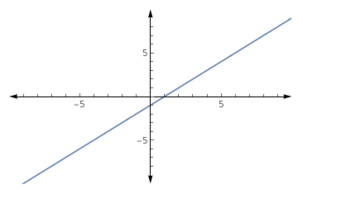
Does this graph represent a proportional relationship?  
a)
No, because it doesn't pass through the origin.
b)
Yes, because it doesn't pass through the origin.
c)
Yes, because it intersects the y axis.
d)
No, because it intersects the x axis.
2.
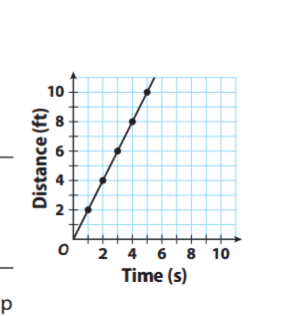
Is the graph proportional or non proportional?
a)
proportional
b)
non proportional
3.
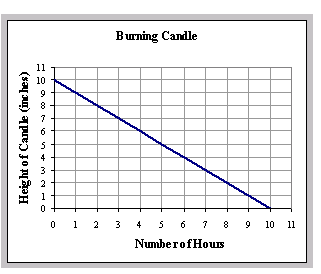
Is the graph proportional or non-proportional?
a)
Proportional
b)
Non-Proportional
4.
Is the graph proportional or non proportional?
a)
proportional
b)
non proportional
5.
Does this graph represent a proportional relationship?
a)
Yes, because the line is pretty.
b)
No, because the line goes through the origin.
c)
Yes because the line goes through the origin.
d)
No, because the graph is non-proportional.
6.
Does this graph represent a proportional relationship?  
a)
No, because it doesn't pass through the origin.
b)
Yes, because it doesn't pass through the origin.
c)
Yes, because it intersects the y axis.
d)
No, because it intersects the x axis.
7.
The graph shows the water level as a bathtub fills.  Select the correct choice that describes this graph.
a)
The graph is linear and proportional.
b)
The graph is linear and non-proportional.
8.
Does the graph show a proportional relationship?
a)
Yes
b)
No
9.
Is the graph proportional or non proportional?
a)
proportional
b)
non proportional
10.
Is the graph proportional or non proportional?
a)
proportional
b)
non proportional
11.
Is the graph proportional or non proportional?
a)
proportional
b)
non proportional
12.
What makes a graph proportional?
a)
Straight line
b)
The line goes through the origin
c)
Curvy line
d)
Straight line and the line goes through the origin
13.
Is the following question statistical or non- statistical?
How tall are the students in our class?
a)
Statistical
b)
Non-Statistical
14.

What is the definition of "median"?

a)

the average of a set of data

b)

the number that appears the most in a set of data

c)

the number in the middle of a set of data

d)

the difference between the greatest and smallest value in a set of data

15.

What is the definition of "mean"?

a)

the difference between the greatest and smallest value in a set of data

b)

the average of a set of data

c)

the number that appears the most in a set of data

d)

the number in the middle of a set of data

16.

What is the definition of "range"?

a)

the difference between the greatest and smallest value in a set of data

b)

the average of a set of data

c)

the number that appears most in a set of data

d)

the number in the middle of a set of data

17.

What is the definition of "mode"?

a)

the difference between the greatest and smallest value in a set of data

b)

the average of a set of data

c)

the number in the middle of a set of data

d)

the number that appears the most in a set of data

18.
What is the mode in this set of numbers:
7, 14, 20, 3, 7, 14, 2, 14, 7
a)
7
b)
20
c)
7 & 14
d)
none of the above
19.
Find the mean of these numbers:
5,11,2,12,4,2
a)
4.1
b)
6
c)
4.5
d)
4
20.
Find the range of these numbers:
15,2,3,7,8,4,3,2,16,2,4
a)
2
b)
13
c)
14
d)
7
21.
Find the median of these numbers:
4,2,7,4,3
a)
2
b)
5
c)
7
d)
4
22.
What is the MODE of this data?
a)
90
b)
85, 90, and 95
c)
85 and 95
d)
None
23.
What is the range of the test scores?
a)
15
b)
100
c)
6
d)
10
24.

Find the IQR (Q3 - Q1)  of the data

20, 22, 25, 29, 31

a)
30
b)
21
c)
25
d)
9
25.

What does M.A.D stand for?

a)

Mean as Dirt

b)

Mean Average Deviation

c)

Crazy

d)

Mean Absolute Deviation

26.
Find the MAD:
58, 38, 54, 48, 26, 36
a)
43
b)
20
c)
10
d)
12
27.
Determine the mean absolute deviation of the data.
9, 7, 11, 10, 8
a)
9
b)
6
c)
1.2
d)
5
28.

True or false?:The absolute value of a number will always be positive.

a)

True

b)

False

29.

What is the first step (1-2) when calculating the Mean Absolute Deviation?

a)

Find the distance each value is from the mean

b)

Find the mean of the data

c)

Find the mean of the distances

30.
Determine the mean absolute deviation of the data.
9, 7, 11, 10, 8
a)
9
b)
6
c)
1.2
d)
5
31.
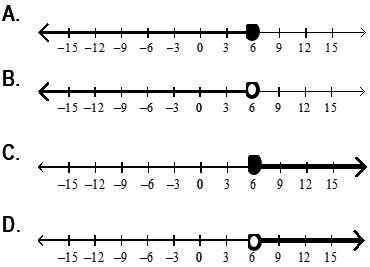
Which graph matches the inequality
k < 3?
a)
A
b)
B
c)
C
d)
D
32.
Which graph matches the inequality
r ≥ -6?
a)
A
b)
B
c)
C
d)
D
33.
Which inequality matches the graph?
a)
A
b)
B
c)
C
d)
D
34.
Which inequality matches the graph?
a)
A
b)
B
c)
C
d)
D
35.

When graphing b < 6 would you use an open or closed circle?

a)

Open

b)

closed

36.
When graphing b ≤ 6 would you use an open or closed circle?
a)
Open
b)
closed
37.

What inequality does the number line graph represent?

a)

x ≤ 4

b)

x ≥ -4

c)

x < -4

d)

x < 4

38.
What inequality does the number line graph represent?
a)
x ≥ 3
b)
x > 3
c)
x < -3
d)
x ≤ -3
39.
Match the graph with its inequality.
a)
a > 11
b)
a < 11
c)
a ≥ 11
d)
a ≤ 11
40.
Pick the correct letter for:
6 > x
a)
A
b)
B
c)
C
d)
D