
NEW
Font size
S
M
L
XL
 Worksheets
Simple Linear Regression
Total questions: 10
Worksheet time: 14mins
Name
Class
Date
1.
Measures computed from Sample Data are called Statistics.
a)
TRUE
b)
FALSE
2.

Describe the correlation in the graph shown.
a)
Strong Negative
b)
Strong Positive
c)
Weak Negative
d)
Weak Positive
3.
Simple linear regression requires that the scales of measurement be expressed in either
a)
interval or ratio
b)
nominal or ordinal
c)
ordinal or ratio
d)
nominal or interval
4.

Write the linear regression equation for the following data points. Round to the nearest tenth.
a)
y=−0.27x+3.93
b)
y=3.93x+−0.27
c)
y=1.25x+3.75
d)
y=0.27x+3.94
5.
Which scatter plot diagram shows the strongest positive correlation?
a)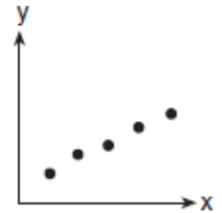
b)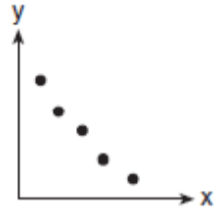
c)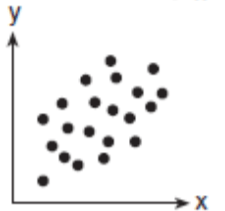
d)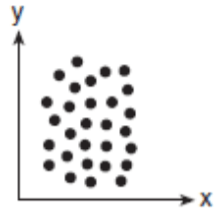
6.

A restaurant sells pizza for the prices in the data table. Calculate the linear regression equation of the data.
a)
y = 1.5x + 12
b)
y = 12x + 1.5
c)
y = 0.67x - 8
d)
y = -8x + 0.67
7.
If the least-squares equation is y=5+2x, then an increase of 1 unit in x is associated with an increase of 2 units of y.
a)
TRUE
b)
FALSE
8.

a)
Positive, strong
b)
Positive, weak
c)
Negative, strong
d)
Negative, weak
9.

Rank these scatter plots according to the intensity of the correlation represented, from weakest to strongest.
a)
1, 2, 3, 4
b)
2, 4, 3, 1
c)
4, 3, 2, 1
d)
1, 3, 4, 2
10.

What kind of correlation?
a)
Positive
b)
Negative
c)
No
Reset

