
 Worksheets
Year 5: Data handling - Google Forms
Total questions: 10
Worksheet time: 5mins
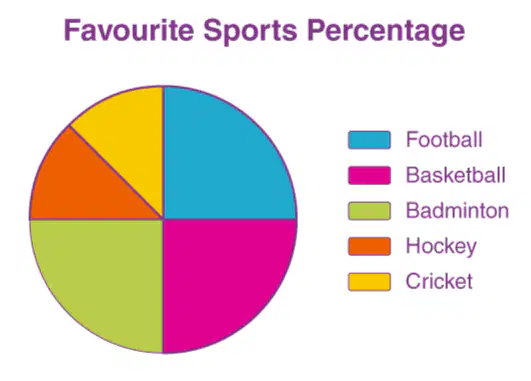
This is a type of charts available in Google Forms responses summary. What kind of chart is this?
Scatter plot
Bar chart
Line graph
Pie chart
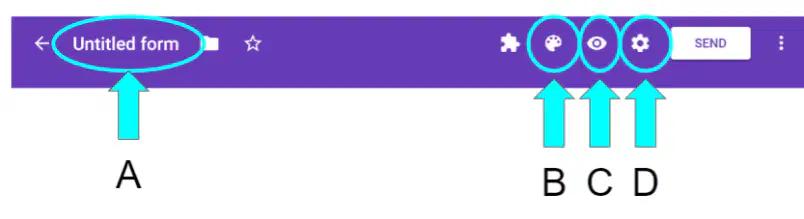
Which option you should click to change the Google Forms theme and colour?
A
B
C
D
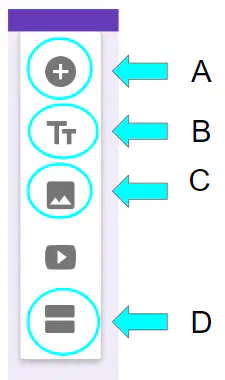
Which icon should you click so that you can add an image to your Google Form?
A
B
C
D
Which icon should you click so that you can add a new question?
A
B
C
D
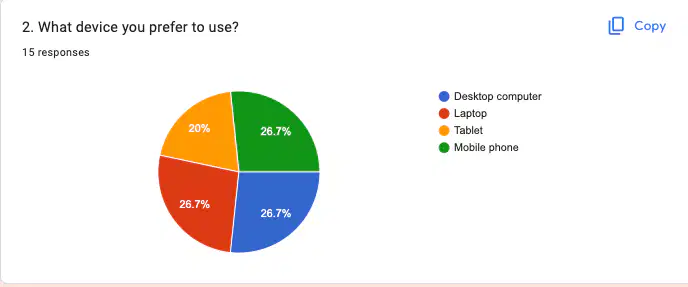
Based on the response summary, which device is less use by the respondents?
Desktop computer
Laptop
Tablet
Mobile device
How many people have answering the Google Forms?
10
15
20
50
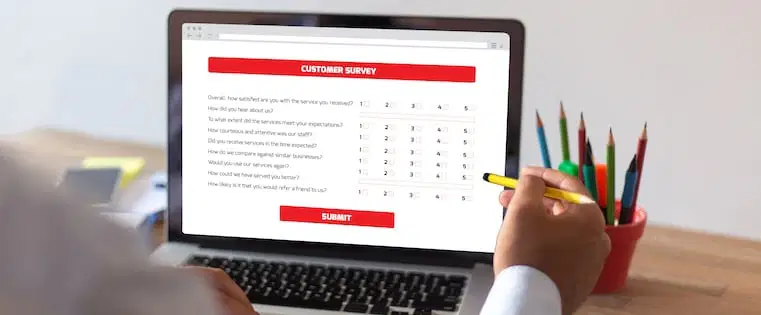
What are the benefits of a digital survey over a paper one?
Can easily share link through email
Immediately can check the survey responses
Need to print out before distribute it people
Using more time to create the online survey
What is the purpose of completing a survey?
To understand online safety topics
To analyse data
To learn about Google Forms
To gather information

What is the next step after creating and sharing the survey?
Analysing the data using a spreadsheet
Completing all the surveys
Creating a new survey
Sharing the survey on social media
Which of the following are Google Forms used for?
Sending emails
Conducting surveys and quizzes
Creating presentations
Editing images

