
 Worksheets
position-time graphs
Total questions: 40
Worksheet time: 28mins


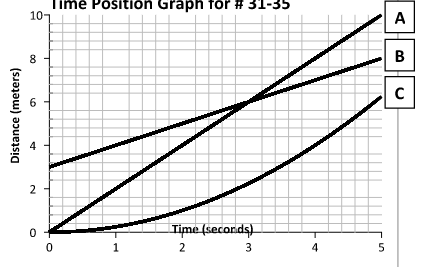

from 3rd second to 5th second, the object is
moving at a constant speed
speeding up
not moving
slowing down

What is happening at E?
Stationary
Accelerating
Fast steady speed; moving away from the starting position
Steady speed; returning to start position
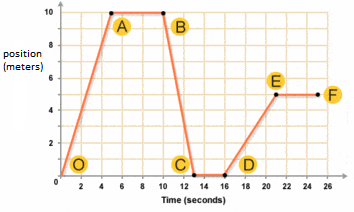
What is happening in this graph from point B to C?
The object is going down a hill.
The object is returning to its starting location.
The object is slowing down.
The object is staying still.
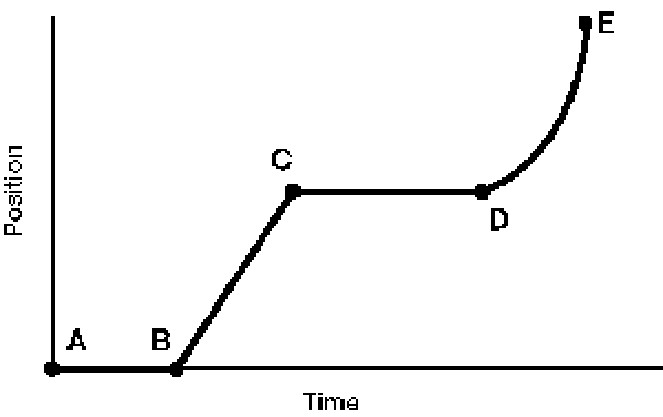
From t=1.0 second to t=3.0 seconds, the object is
moving at a constant speed
speeding up
not moving
slowing down
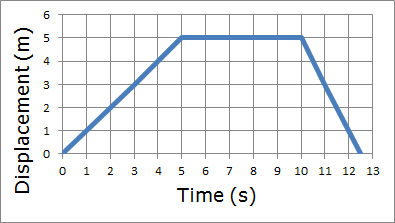
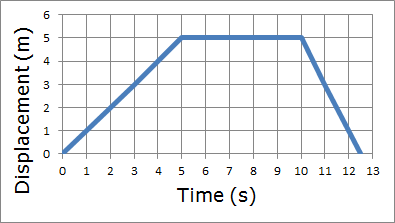
According to the graph how far does the person travel in the first 5 seconds?
2 m
10 m
0 m
5 m
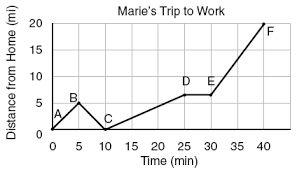
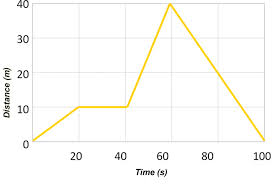
When was Marie driving the fastest?
C to D
D to E
E to F
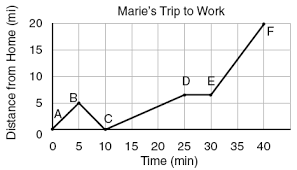
What could account for Marie’s motion at 27 minutes?
She was late so she broke the speed limit
She forgot something at home and ran back to get it
She was stopped at a red light
She was driving across the top of a hill
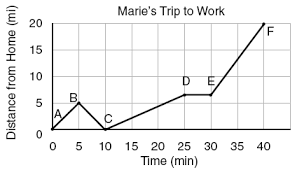
It usually takes Marie 30 minutes to get to work. Did her trip take...
The average amount of time.
Longer then average amount of time.
Shorter then average amount of time.
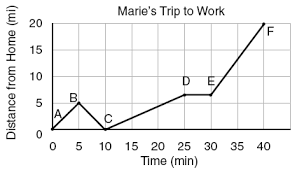
How far away is Marie's work from her house?
40 mi
25 mi
20 mi
5 mi
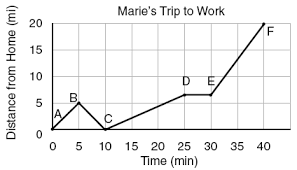
How far did Marie go before she turned around?
20 mi
5 mi
10 mi
25 mi
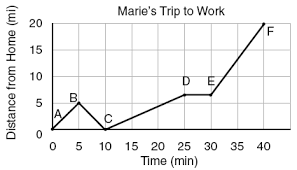
During what period of time was Marie stopped?
0-5 minutes
5-10 minutes
10-25 minutes
25-30 minutes
What does the slope of a velocity-time graph represent?
Distance
Displacement
Velocity
Acceleration
When was Marie driving the fastest?
C to D
D to E
E to F

Which two cars are travelling in the negative direction?
Car A
Car B
Car C
Car D
Car E
Which car is not moving?
Car A
Car B
Car C
Car D
Car E
Which car is travelling fastest in the positive direction?
Car A
Car B
Car C
Car D
Car E
In which of the following graphs below are both runners moving at the same speed?


According to the graph, what was the Speed for the first 5 seconds?
1 m/s
0.5 m/s
5 m/s
2 m/s
According to the graph, what was the Velocity for the time interval between 10 and 12 seconds?
-2.5 m/s, meaning to the left
-0.5 m/s, meaning to the left
-2 m/s, meaning to the left
2 m/s, meaning to the right
2.5 m/s, meaning to the right


Consider the graph shown below. Which description below is consistent with the graph?
The object moves slowly at a constant speed and then faster at a constant speed.
The object accelerates in the positive direction and then accelerates more rapidly.
The object moves forward, changes direction and then accelerates more rapidly.

