
 Worksheets
Production Possibilities and More
Total questions: 25
Worksheet time: 16mins

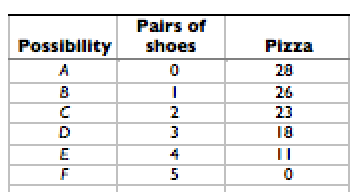
The table shows the production possibilities for a country. Based on the table, which of the following production combinations is a possibility?
28 pizzas and 5 pairs of shoes
3 pairs of shoes and 23 pizzas
2 pairs of shoes and 20 pizzas
4 pairs of shoes and 15 pizzas
the best opportunity one has to give up in order to gain something else
What phrase does an economist use to describe Land, Labor, Capital, and Entrepreneurship
Portfolio Diversification
Goals of Society
Maximum Resources
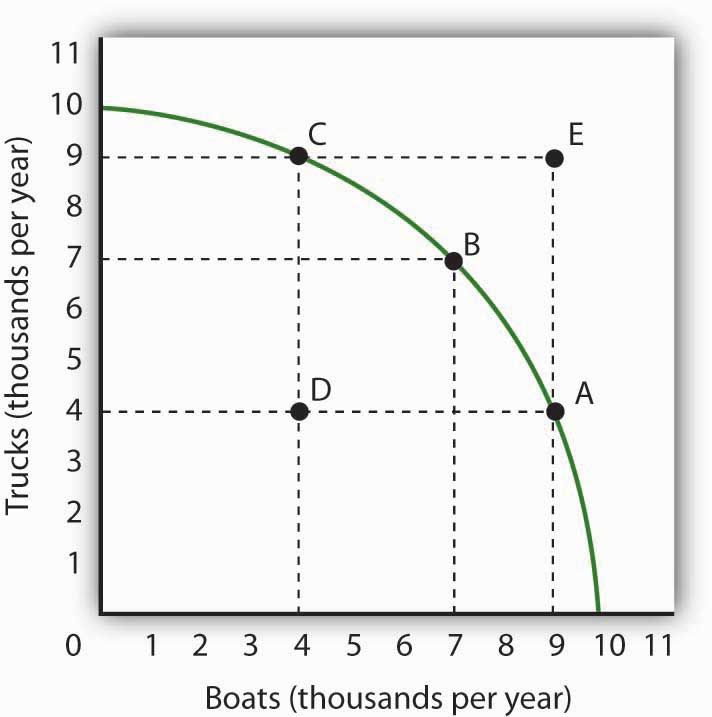
The opportunity cost of increasing production from 7000 trucks to 9000 trucks is
3 boats
2000 trucks
3000 boats

The opportunity cost of increasing production from 4000 boats to 7000 boats is
3000 trucks
3000 boats
2000 trucks
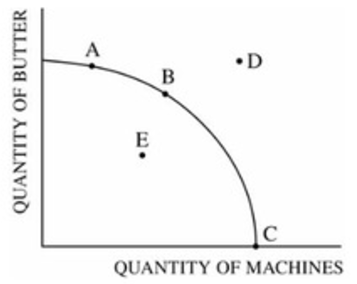
What do any points inside the Production Possibilities Curve indicate?
The combination of goods that are efficient
The combination of goods and spending that will overheat the economy
An increase in the labor force would cause the Production Possibilities Curve to
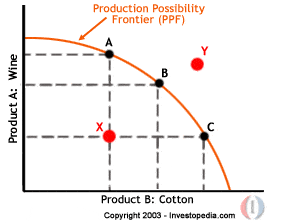
Maximum Efficiency
Unattainable or Impossible Production Point given current resources
Inefficiency or Wasting of Materials
Better Well Being for all of Society

If a natural disaster strikes, the production possibilities curve will most likely shift
a new invention or improved technology
What does a point inside the production possibilities curve indicate?
Unattainable combination
Economic growth
Underutilization of resources
Efficiency
What does a bowed out production possibilities curve indicate?
No opportunity cost
Constant opportunity cost
Increasing opportunity cost
Decreasing opportunity cost
What does a straight line production possibilities curve indicate?
Constant opportunity cost
Increasing opportunity cost
Decreasing opportunity cost
No opportunity cost
The study of the economy as a whole is known as what?
macroeconomics
microeconomics
underutilization
scarcity
What is an example of an Opportunity Cost?
Adopting a new pet
Going to a party instead of studying for an exam
Getting a new job after school
Using all your resources to accomplish a goal

Why is point D inefficient in this scenario?
Point D is on the Production Possibilities Curve
Point D is not illustrated on the graph
Resources at Point D are not being fully used in the goods and services production
Point D is beyond the ability to produce goods and services at the time
What are Trade offs?
Points where all resources available are employed in the production of goods and services.
Trading your problems for money
The idea you can have everything you want
The idea that if you choose one thing, you are going to lose another.

Would meeting point E be possible in this scenario?
Yes, the resources can grow over time
No, because the point lies outside what the resources can produce at the time.
Yes, point E represents an optimal state for the producer
Maybe, the possibilities are infinite in this scenario
What does PPC stand for?
Production Per Citizen
Power Plant Corporation
Production Possibilities Curve
Proficient Possibilities Curve

