
 Worksheets
REVISION - 8IG1E0
Total questions: 35
Worksheet time: 18mins
A student draws a diagram of a chicken's egg and includes the magnification, m, of the drawing.
The student writes m = x2.
The image length on the diagram is 140 mm.
What is the length of the actual chicken's egg?
35 mm
70 mm
140 mm
280 mm

A cylindrical can is rolled along the ruler shown in the diagram.
The can rolls over twice.
What is the circumference (distance all round) of the can?
13 cm
14 cm
26 cm
28 mm

The diagram shows four identical spheres placed between two wooden blocks on a ruler.
1 cm
2 cm
3 cm
4 cm

A
B
C
D

A student uses a piece of string to measure the circumference of a pencil.
He wraps the string around the outside of the pencil. The string wraps round exactly six times.
He measures the length of string used with a ruler. What is the circumference of the pencil?
2.4 cm
2.6 cm
14.4 cm
15.4 cm

Diagram 1 shows a measuring cylinder containing water. Five identical steel balls are now lowered into the measuring cylinder. Diagram 2 shows the new water level in the cylinder. What is the volume of each steel ball?
6 cm3
14 cm3
30 cm3
70 cm3

A stopwatch is used to time a runner in a race. The diagrams show the stopwatch at the start and at the end of a lap of the race.
How long did the runner take to finish the lap of the race?
A 50.00 seconds
B 50.10 seconds
C 90.00 seconds
D 100.10 seconds
A
B
C
D

A
B
C
D

A
B
C
D
A
B
C
D

A
B
C
D
A
B
C
D
A train begins a journey from a station and travels 60 km in a time of 20 minutes.
What is the average speed of the train?
3.0 m / s
5.0 m / s
50 m / s
60 m / s
In a race, a car travels 50 times around a 3.6km track. This takes 2.5 hours.
What is the average speed of the car?
1.44 km/ h
72 km/ h
180 km/ h
450 km/ h
A man climbs up a vertical cliff that is 60m high. He takes two hours to reach the top. What is the average vertical speed of the man?
0.0083 m/s
0.5 m/s
30 m/s
120 m/s

A car travels 6.0 km along a main road in 6.0 minutes. It then travels 2.0 km along a minor road in 6.0 minutes. Which calculation of average speed for the whole journey is correct?
8.0 ÷ 12.0 = 0.67 km / minute
12.0 ÷ 8.0 = 1.5 km / minute
8.0 + 12.0 = 20 km / minute
8.0 × 12.0 = 96 km / minute

A tennis player hits a ball hard and 0.40 s later hears the echo from a wall.
The speed of sound in air is 330 m / s.
How far away is the player from the wall?
66 m
132 m
264 m
825 m

Which distance / time graph represents the motion of an object moving at constant speed?
A
B
C
D

Two distance-time graphs and two speed-time graphs are shown.
Which graph represents an object that is at rest?
A
B
C
D

The graph shows how the distance travelled by a vehicle changes with time. Which row describes the speed of the vehicle in each section of the graph?
A
B
C
D

An object moves initially with constant speed and then with constant acceleration. Which graph shows this motion?
A
B
C
D

The graph shows how the speed of an object varies with time.
Which graph is the distance-time graph for this object?


An object travelling in a straight line accelerates from a speed of 6.0 m/s to a speed of 15 m/s in 6.0 s.
What is the acceleration of the object?
A 1.0 m/s2
B 1.5 m/s2
C 2.5 m/s2
D 3.5 m/s2
A
B
C
D

Which speed – time graph represents an object moving with an acceleration of 2.0 m/s2
A
B
C
D

The graph shows how the speed of an object varies with time. How is the motion of the object described during the time shown by graph?
A moving at the start, then increasing speed with constant acceleration
B moving at the start, then increasing speed with increasing acceleration
C starting from rest, then increasing speed with constant acceleration
D starting from rest, then moving at a constant acceleration
A
B
C
D

The graph shows how the speed of an object varies with time.
What is the distance moved by the object between time 0 s and time 10 s?
30 m
40 m
50 m
80 m

Which distance – time graph represents an object that is decelerating?
A
B
C
D
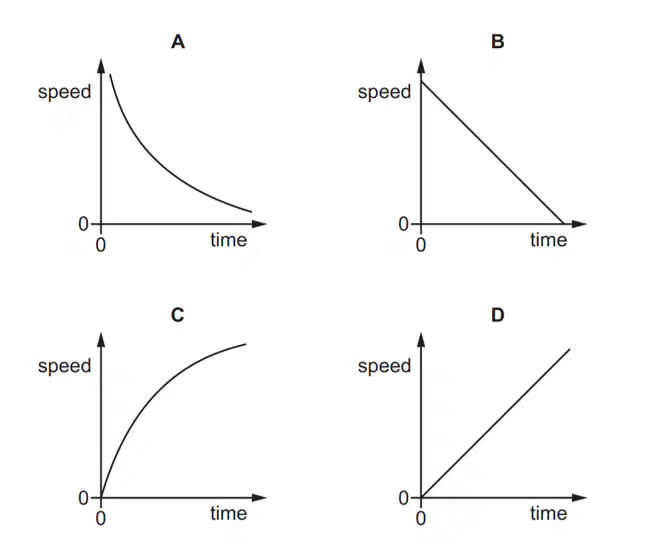
An object falls freely in a vacuum.
Which speed-time graph represents the motion of the object?
a
b
c
d
What is the different between speed and velocity
speed has mangnitude and direction; velocity has magnitude only
speed has mangnitude and direction; velocity has direction only
speed has mangnitude only; velocity has magnitude and direction
speed has magnitude only; velocity has direction only

The speed - time graph represents the journey of a bicycle. What is the total distance travelled by the bicycle?
1.6 km
2.0 km
2.4 km
3.2 km
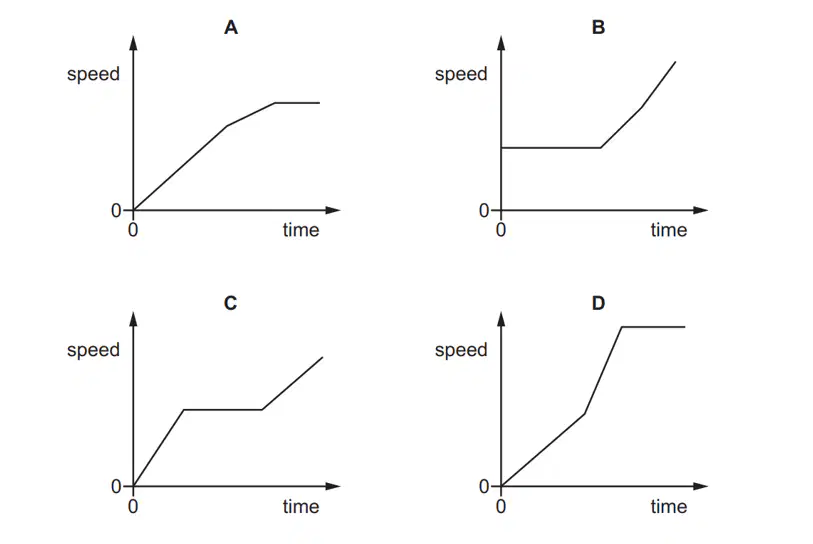
The speed-time graphs represent the motion of a car moving in a straight line. Which graph represents the car moving first with a constant acceleration, then with a larger constant acceleration and then with a constant speed?
A
B
C
D
Which statement describes a vector?
It has magnitude but no direction
It has direction but no magnitude
It has both direction and magnitude
It has constant magnitude but no
direction
Which of the following quantities are vectors?
speed, velocity, acceleration, gravitational field strength
force, weight, gravitational field strength, acceleration
acceleration, mass, gravitational field strength, acceleration
weight, energy, gravitational field strength, acceleration

The graph represents the motion of a car. What is the distance travelled by the car while it is moving at a constant speed?
100 m
150 m
250 m
350 m

The diagram shows the speed/ time graph for a train as it travels along a track. For which part of the graph is the train’s speed changing at the greatest rate?
PQ
QR
RS
ST

