
 Worksheets
Reading Graphs
Total questions: 15
Worksheet time: 30mins

This line graph shows the height of two plants that Samantha grew for four weeks.
During which week were the plants the same height?
1
2
3
4

What pattern does the graph show?
For every pizza sold, the school earns $1.00.
For every pizza sold, the school earns $2.00.
For every pizza sold, the school earns $3.00.
For every pizza sold, the school earns $4.00.

This graph shows the number of vacation days earned for each month worked.
How many days will Cole earn after working for 6 months?
7
9
10
12

How much would 1 pound of fudge cost at the store?
$2
$4
$6
$3
How much would 0.25 of a pound of fudge cost at the store?
$2
$0.50
$0.25
$1

What amount of sales make the company $2000 in profit?
3000
6000
9000
12000

The graph shows the movement of an object.
How long did it take this object to travel 10 m?
0 s
10 s
15 s
20 s

Segment A-B The bus is _________________.
at rest
returning (to original position)
moving forward
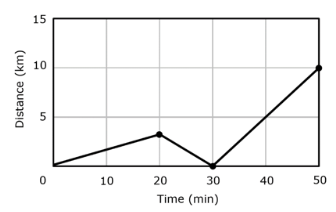
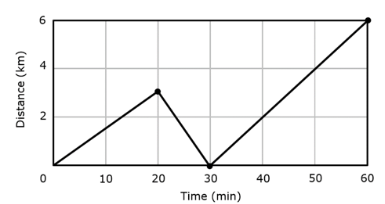
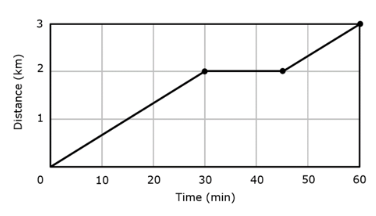
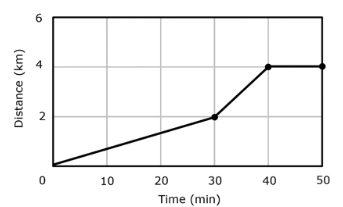
A student walks 2.0 km in a time of 30 minutes. The student then stop for 15 minutes to eat a snack then travels 1.0 km in 15 minutes.
Which graph shows the journey described?

Ellie cycled from her home to her friendʼs house.
She stayed at her friendʼs house and then traveled home.
How far was Ellie from home while visiting her friend?
7 km
8.2 km
8 km
7.8 km


The y-axis is vertical (up and down).
True
False
The x-axis is horizontal (flat).
True
False


