
 Worksheets
Basics of Science/Graphing
Total questions: 24
Worksheet time: 20mins
Which of the following best describes an independent variable?
a factor that is changed or manipulated in an experiment
a factor that is measured or counted in an experiment
a factor that will change in response to another variable
a factor that is not changed or manipulated in an experiment
Which of the following best describes a dependent variable?
a factor that is changed in an experiment
a factor that is controlled by the experimenter
a factor that is measured or counted in an experiment and will change as a result of another variable
a factor that is manipulated by the investigator
On which axis does the independent variable go on?
On which axis does the dependent variable go on?
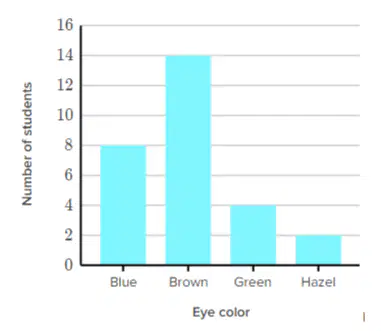
Ms. Calender took a survey of her 7th period to determine the frequencies of different eye color.
The number of students with brown eyes is:
Greater than the number of students with green, blue, and hazel eyes combined.
Less than the number of students with green, blue, and hazel eyes combined.
Equal to the number of students with green, blue, and hazel eyes combined.
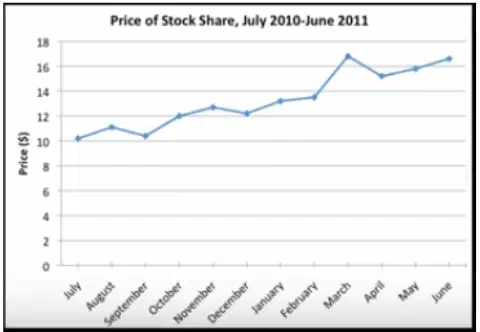
An investment firm creates a graph to show the performance of their stock over 12 months. Over the course of the year, is the price rising, falling, or staying the same?
Rising
Falling
Staying the same
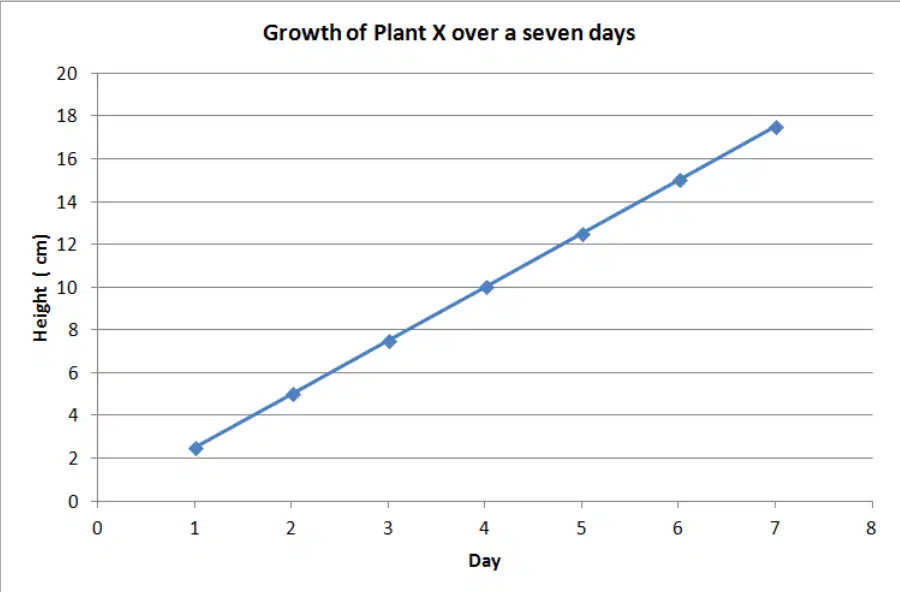
What is the dependent variable of the graph?
Sunlight
Day 7
The day
Height (cm)
Match the type of graph with the correct image.

Pie Chart

Line Graph

Bar Graph

Scatter Plot
Mrs. J. knew that students who attended her morning study sessions performed better on science tests but very few students attended them. She wanted to test if bringing doughnuts to the study sessions would increase student attendance. She continued to advertise the sessions in the same method and hold sessions at the same time. The only difference was that she brought doughnuts to the session. She had a 50% increase in attendance when she brought the doughnuts.
What is the dependent variable?
The number of students who attend the study session
The doughnuts
The test
The study session

What is labeled along the "Y" axis?
Bubbles/min
Depth (m)
Plant X
Minutes
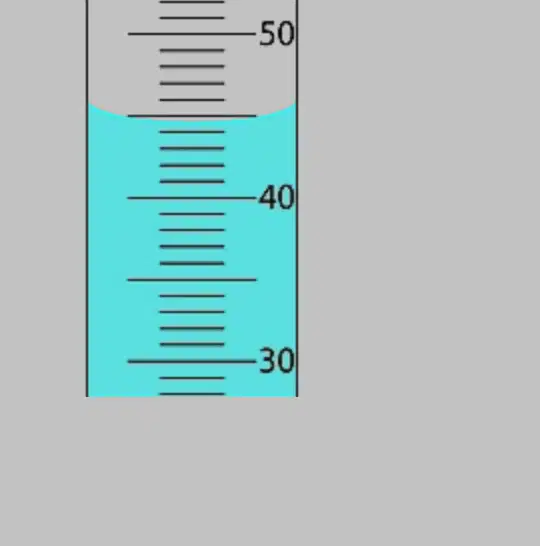
What is the volume of liquid in this graduated cylinder?
40 ml
44 ml
45 ml
46 ml
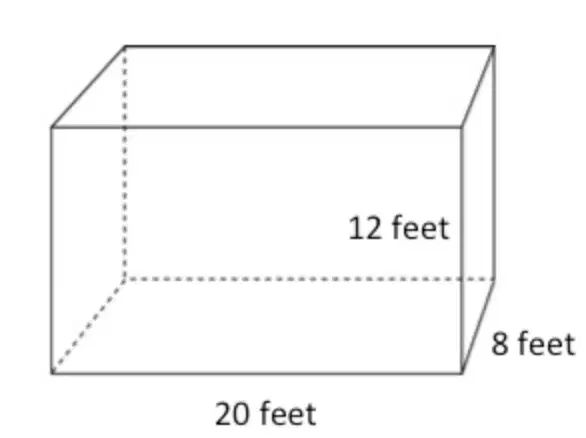
How would I set up the equation to solve for the volume of this box?
12 feet x 8 feet x 20 feet = volume
12 feet + 8 feet + 20 feet = volume
20 feet - 12 feet - 8 feet = volume
20 feet ÷ 12 feet ÷ 8 feet = volume
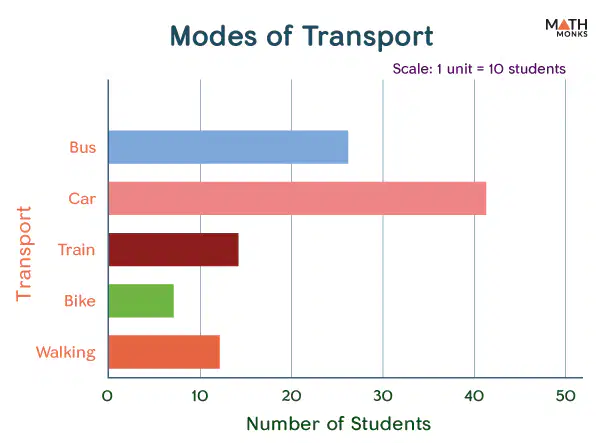
Which mode of transport is used the LEAST amount by students?
Bus
Car
Train
Bike
Walking
Which of the following are important when creating a graph in science?
Title of Graph
Units
Labeled X and Y Axis
All of these
Which variable responds to what is being tested?
independent
dependent
control
What is the INDEPENDENT VARIABLE?
Annabelle wanted to know if Bic pens would last longer if she used cardstock rather than copy paper. She used 5 Bic pens on cardstock and 5 Bic pens on copy paper. She used the same color ink in every pen.
Amount of time
Type of Paper
Annabelle
color of ink
An experiment is performed on plants to see how different amounts of water affect plant growth. Each plant in the experiment is given a different amount of water; 2 cups of water, 3 cups of water, and 5 cups of water. Each plant has the same amount of soil, sunlight, and listens to the same music. In this investigation, the dependent variable is ...
The height of the plant
The amount of water

Variable that the scientist changes, tests, or manipulates is
Control Variable
Variable
Dependent Variable
Independent Variable
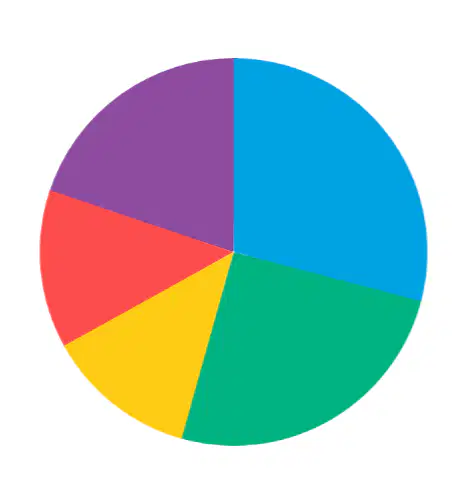
What are pie charts best used to illustrate?
Proportions of a whole or relative sizes of data
Match the following graph types with what it is used for
Bar graphs
Used to compare different categories
Line graphs
Shows trends over time
Pie charts
Represents parts of a whole
Scatter plots
Visualizes relationship between two variables
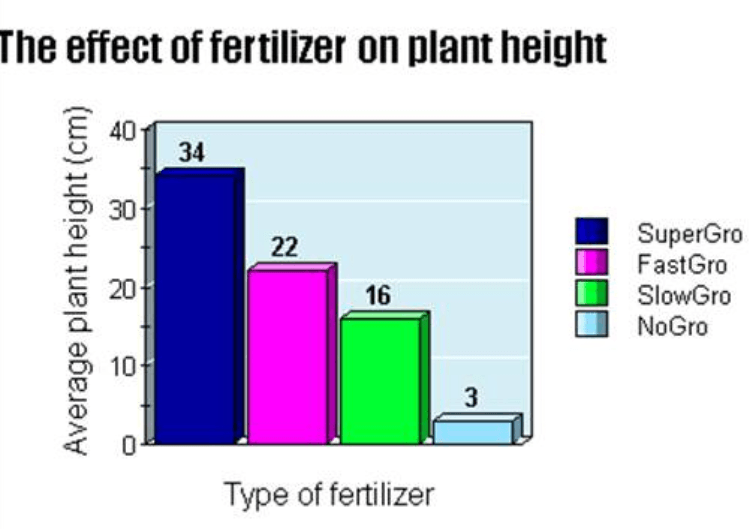
What is the dependent variable?
Type of fertilizer
Average plant height
The effect of fertilizer on plant height
The effect of plant height on fertilizer
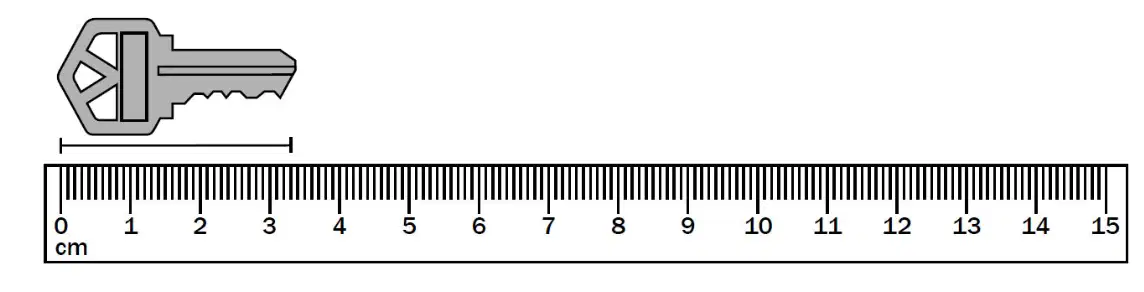
What is the length of the key?
3.3 mm
3.3 cm
3 cm
3 mm

