
 Worksheets
Graphing Quiz Review
Total questions: 12
Worksheet time: 6mins
Name
Class
Date
1.
Graphs show (a) between two or more things. *You must spell the word correctly, or it will count it wrong.
2.
True or false- The x-axis (independent variable) runs vertically (up and down).
a)
True
b)
False
3.
Clayton wants to record results for the temperature of each day in the past week. What graph should he use?
a)
Bar
b)
Line
c)
Pie Chart
d)
Scatter Plot
4.
This graph shows part of a whole.
a)
Bar
b)
Line
c)
Pie Chart
d)
Scatter Plot
5.
This graph is the best choice if you want to compare data.
a)
Bar
b)
Line
c)
Pie Chart
d)
Scatter Plot
6.
What type of graph should you choose for a data table that shows percentages of pizza toppings chosen?
a)
Bar
b)
Line
c)
Pie Chart
d)
Scatter Plot
7.
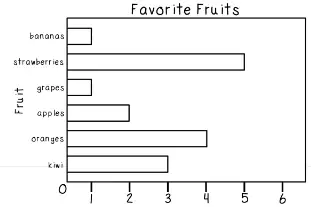
What is missing from this graph?
a)
Title
b)
Data
c)
x-axis label
d)
y-axis label
8.
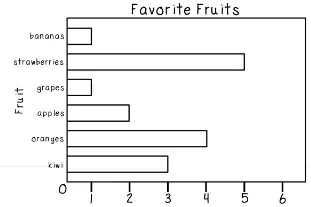
According to this graph, which fruit is the favorite?
a)
Oranges
b)
Bananas
c)
Kiwi
d)
Strawberries
9.
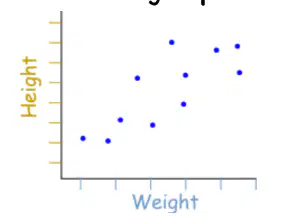
What does this graph help you visualize?
a)
Change of height over time
b)
Relationship between height and weight
c)
Comparing weight of different players
d)
Showing the parts of a team
10.
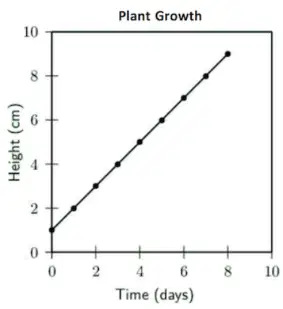
What is the independent variable in this graph?
a)
Plant growth
b)
Height
c)
Time
d)
Days
11.
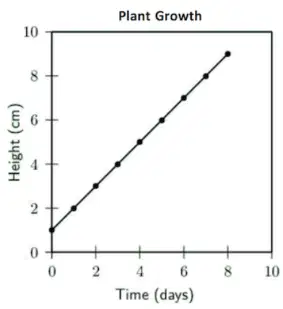
How tall was the plant on day zero (0)?
a)
0 cm
b)
1 cm
c)
2 cm
d)
3 cm
12.
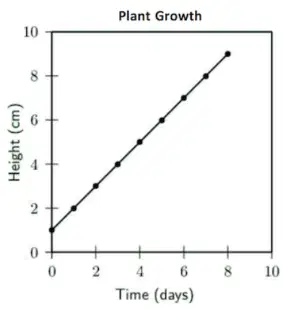
What can you infer from this graph about plant growth?
a)
The plant is not growing at all
b)
The plant is growing 1 cm each day
c)
The plant is growing 2 cm each day
d)
The plant is growing 1 cm each week
100 %

