
 Worksheets
Texas Studies Weekly Week 2 Assessment
Total questions: 12
Worksheet time: 7mins
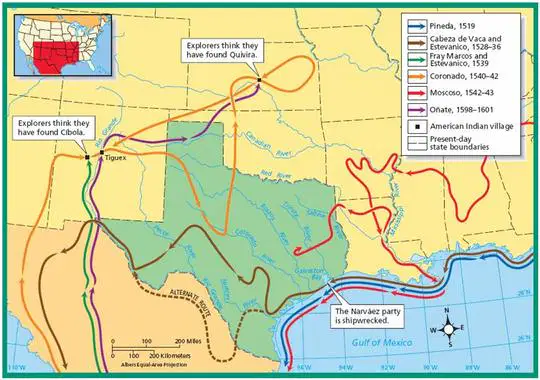
How many miles did Cabeza de Vaca travel across Texas?
50
250
500
750

Which city is southeast of El Paso?
Dallas
Amarillo
Fort Worth
Brownsville
What type of map represents a different time period?
climate
historical
physical
population
There are different ways we can study the world's geography. A globe is a round model of the Earth. Globes show us where water, land, and countries are located. Globes are useful when you need to see the Earth in a more accurate, spherical shape.
What conclusion can be made about maps from the passage?
Map scales are too large
Pictures on maps are incorrect
A compass rose does not point north
Earth cannot be accurately represented flat
The person who creates a map is called a cartographer. A cartographer has a point of view and decides what to include on a map.
Imagine you are asked to make a map of your school. As a cartographer, what is one thing you should always include?
(a)
How do maps help people describe location?
They always point north
They provide pictures of landforms
They represent distances between places
They contain population and climate data
Identify each example of absolute location. Choose all that apply.
H, 12
1234 Main Street
below the billboard
next to the gas station
north of Pummel Peak
Which map contains mountains?
political
physical
cultural
population
What tells the distance on a map?
scale
grid
legend
title
What is an example of relative location?
2024 Panther Way
Latitude: 21° 18' 24.98" N
Longitude: -157° 51' 29.99" W
2101 Acorn Street
My house is around the corner from the park
What are the numbers and letters along the margins of a map?
addresses
coordinates
grids
scales
What map is used to show the overall distribution of the population within a certain area or region?
climate
political
population
cultural

