
 Worksheets
Digital Technology Test
Total questions: 50
Worksheet time: 1hrs 4mins
What is an algorithm?
A list of instructions
Computer code
A programming language
A type of musical instrument
What is the name of a labelled place in the computer's memory where a single item of data can be stored?
Algorithm
Iteration
Variable
Array
Which of the following would NOT be stored in a variable?
Lives
Score
Level
Sprite
A 'Repeat Until' block in Scratch is what type of programming?
Conditional
Iteration
Variable
Array
What is the name of a programming method which can store a numbered list of items of data?
Variable
Iteration
Decomposition
Array
On the Scratch stage, what are the coordinates of the centre of the stage?
150, 150
200, 200
0,0
0, 150
In Scratch, what is the purpose of the purple blocks?
Storing important data
Using a block of code several times
Making code stand out
Using code for different sprites
When creating a program, what's the most important thing to do first?
Create all of the sprites and backgrounds
Create all of the code
Understand what you need to do
Test the game several times

What does this code do?
Resets the player to the start position
Starts the game running
Makes the player fall to the ground
Allows the player to jump about

Which corner of the game will the player's sprite appear when this code runs?
Top left
Top right
Bottom left
Bottom right


Based on the data in the table, how many students played the three games that had the highest frequency?
62
57
60
61
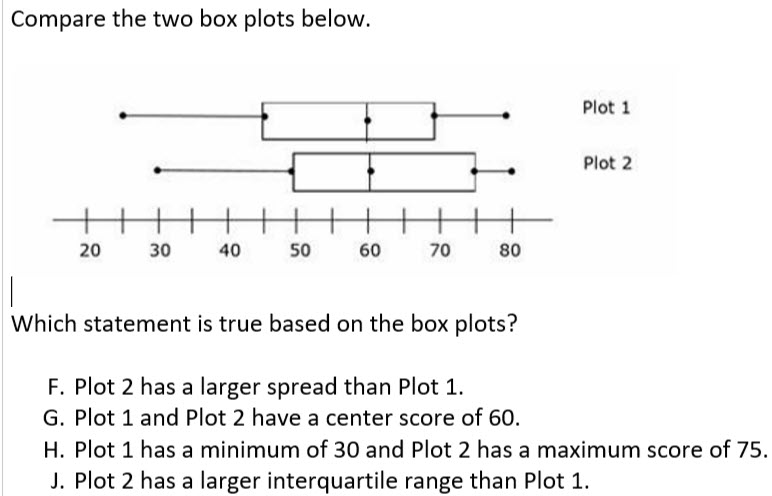
Which statement is true based on the box plots?
Plot 2 has a larger spread than plot 1.
Plot 1 and plot 2 have a center score of 60.
Plot 1 has a minimum of 30 and plot 2 has a maximum score of 75.
Plot 2 has a larger IQR than plot 1.
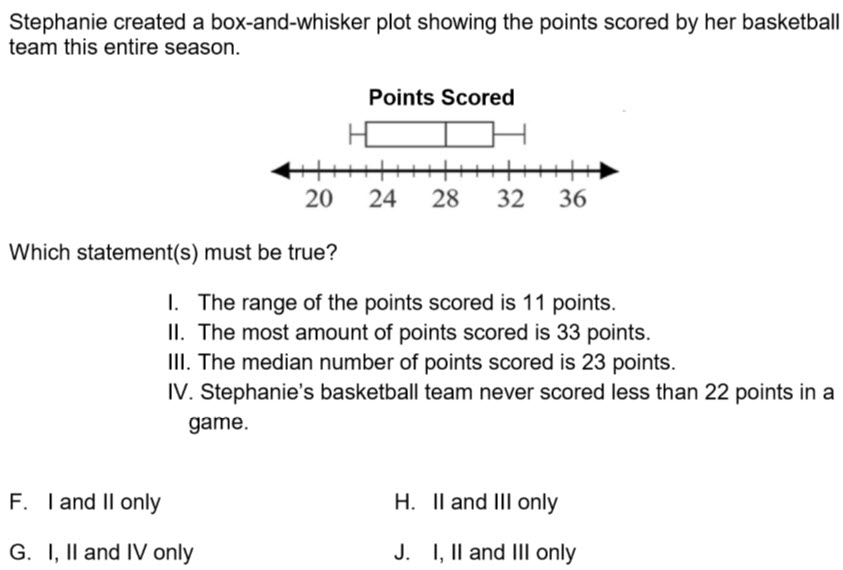
Answer the question pictured.
I and II only
I, II, and IV only
II and III only.
I, II, and III only.
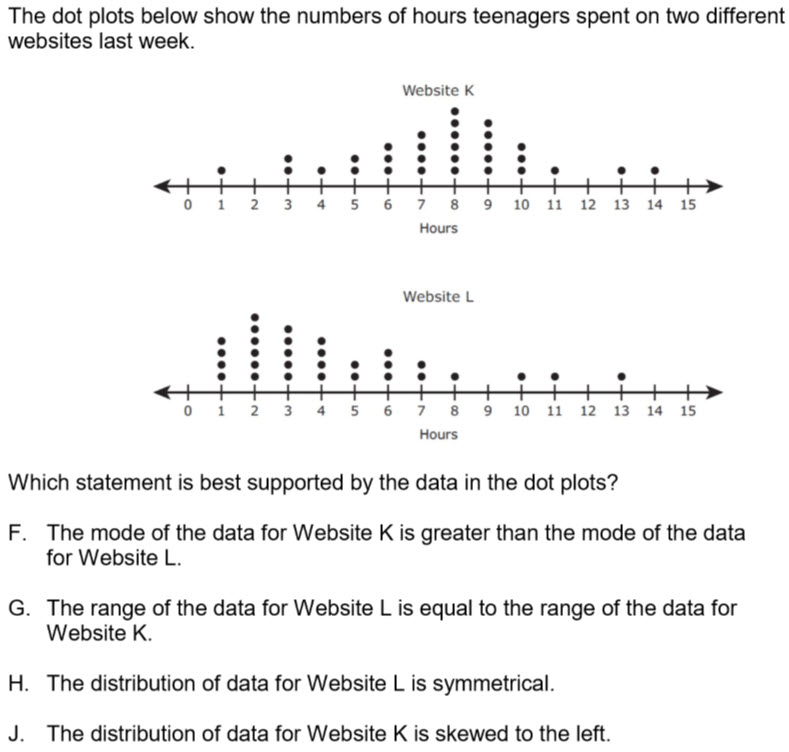
Answer the question pictured.
F
G
H
J

A random sample of 21 students at Daulton Elementary and at Spenser Elementary is asked how many sibling they have. The results are pictured.
When comparing the two populations, which statement is NOT supported by the data?
The students at Spenser Elementary tend to have more siblings than the students at Daulton Elementary.
The range in the data for Daulton Elementary is the same as the range in the data for Spenser Elementary.
The median number of siblings for Daulton Elementary is larger than the median number of siblings for Spenser Elementary.
The students at both elementary schools tend to have 2 or more siblings.
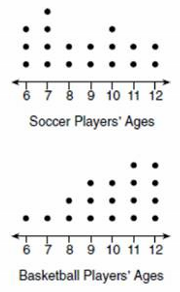
Noah conducted a
survey on sports participation. He created the following two dot plots to
represent the number of students participating, by age, in soccer and
basketball.
Which
statement about the given data sets is correct?
The data for soccer players are skewed right.
The data for soccer players have less spread than the data for basketball players.
The data for basketball players have the same median as the data for soccer players.
The data for basketball players have a greater mean than the data for soccer players.
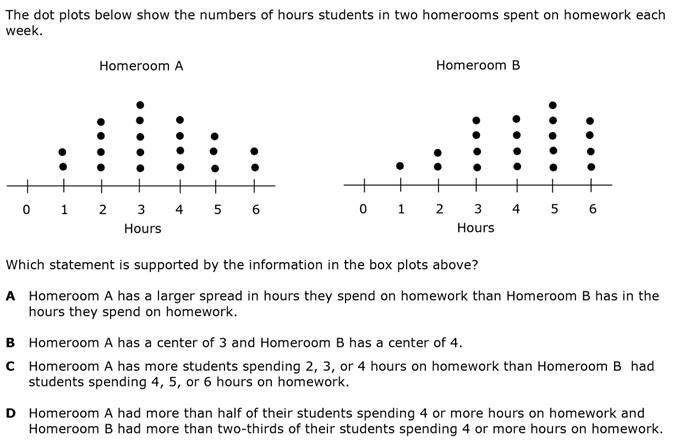
Answer the question pictured.
A
B
C
D
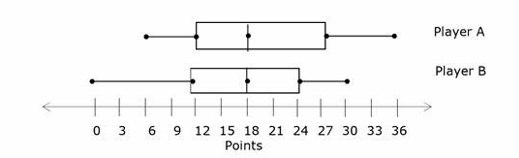
The box plots pictured compare the number of points two basketball players scored per game over 25 games last season.
Which statement is supported by the information in the box plots pictured?
Player A has a larger spread in the points he scored than Player B.
Player A has a larger center than Player B.
Player A scored points in all 25 games, but Player B did not.
Player A and Player B each scored 36 points in at least one of the 25 games.
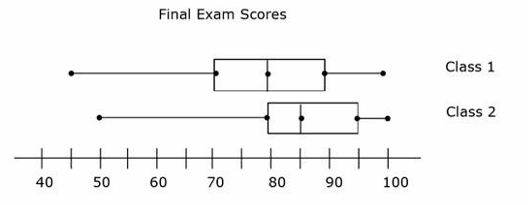
compare the box plots of the results from the final exam that Mrs. Leeward gave her class.
Which statement is true based on the box plots?
Class 2 has a larger spread in their final exam scores than Class 1 has in their final exam scores.
Class 2 has a center score of 85 and Class 1 has a center score of 80.
Class 1 has a minimum score of 50 and Class 2 has a maximum score of 100.
Class 2 has a larger interquartile range than Class 1.
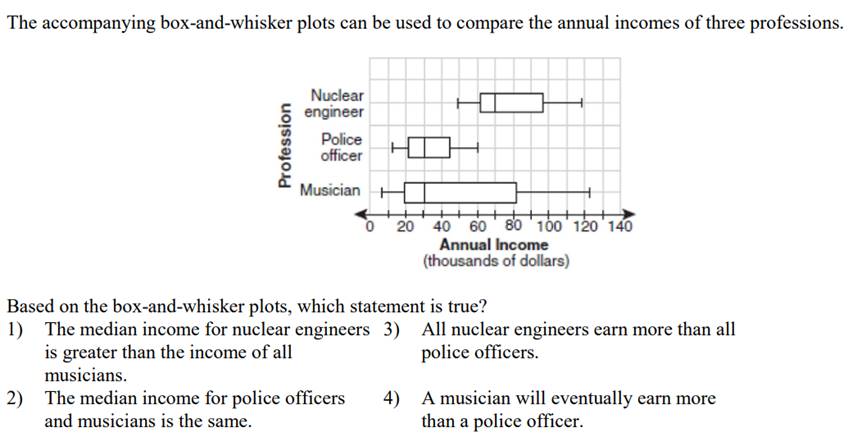
Answer the question pictured.
1
2
3
4
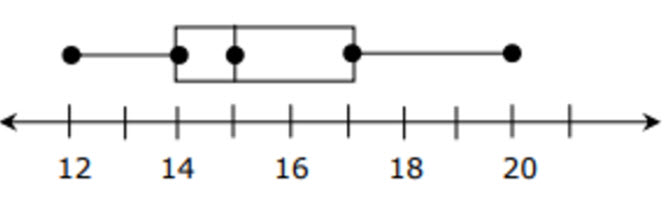
What is the maximum of this box plot?
20
17
15
14
12
What is the minimum of this box plot?
20
17
15
14
12
What is the median/ Q2 of this box plot?
20
17
15
14
12
What is the Q3 of this box plot?
20
17
15
14
12
What is the Q1 of this box plot?
20
17
15
14
12
What is the interquartile range (IQR) of this box plot?
8
3
20
5
14
What is the spread of this box plot?
8
3
20
5
14
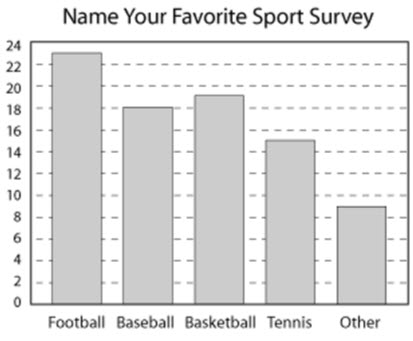
Mateo surveyed his grade to see what everyone said their favorite sport was. The bar graph pictured shows the results.
How many students chose football or baseball?
41
40
42
39



What shape is the data shown in the dot plot?
symmetrical
skewed left
skewed right



Part/total= %/100

Based on a recent survey of 500 students, the circle graph below shows how students communicate
with friends.
How many more students chose social media apps than phone calls to communicate with friends?
36 students
12 students
180 students
300 students
What is the third quartile (UQ) of the data?



