
 Worksheets
Ecosystem and Food Web - Practice Quiz
Total questions: 15
Worksheet time: 8mins

List at least three limiting factors that would negatively affect the squirrel population. (Look/click on the food web!)
amount of seeds/treenuts available
amount of coyotes
amount of bobcats
weather change in another ecosystem

What would be two consequence to the food web if the groundhog population dropped severely due to habitat destruction? (Look closely/click on the picture of the food web!)
Increased plant population due to fewer groundhogs eating them.
Decrease in predator population that relies on groundhogs for food (coyotes, bobcats & vultures).
No significant impact on the food web.
Increase in the population of other herbivores that are part of the ecosystem.

Which organism in this food web can be a part of two different trophic levels? (Look closely/click on the picture of the food web!)
the grass that is both a producer and a consumer making it an omnivore
the Blue Jay bird because it eats seeds (making it a primary consumer) and also eats worms grasshoppers (making it a secondary consumer)
A decomposer (a worm) that is also a producer that likes to produce other plants (making it a producer)
The coyote because it consumes squirrels and ground hogs making it a carnivore

Which organisms in this food web are tertiary consumers (3rd level)? (Look/click on the picture of the chart!)
lion, grass, and shrub
vulture, coyote, and bobcat
shrub, deer, bobcat
blue jay, grasshopper, and seeds/treenuts

How could you increase the environment’s carrying capacity for the Blue Jay bird? (Look closely/click on the picture of the food web!)
By providing more food resources
By reducing the number of predators
By increasing the nesting sites (habitat)
All of the above

Which of the following are ways that humans could negatively impact this ecosystem?
By introducing invasive species.
By removing the producers (ex., deforestation, building on the land)
By removing consumers (ex., overhunting)
By conserving the natural habitat

In a grasslands ecosystem, lions are top consumers (tertiary) that eat antelope. Antelope feed on the grasses that grow in this ecosystem. What impact would the sudden disappearance of lions due to overhunting most likely have on this ecosystem?
More antelopes would eat the grass
The grasses would grow larger
Antelopes would start to eat each other
The climate would grow increasingly larger

Soil organisms, such as fungi, worms and bacteria are all parts of a woodland ecosystem. What best describes the role of these organisms in the woodland ecosystem?
Primary producers
Primary consumers
Secondary consumer
Decomposers
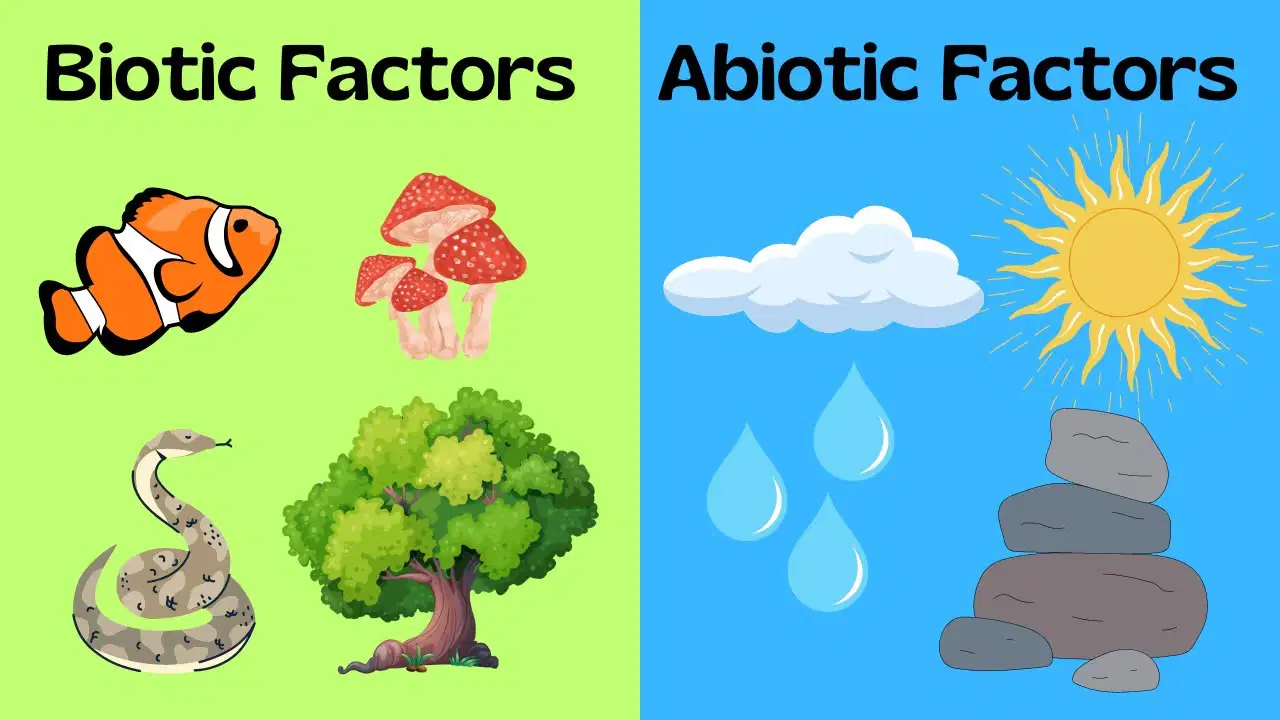
Which of the following is considered a biotic component?
Water
Temperature
Your Friend
A Rock

All of the communities, ecosystems, biotic and abiotic components make up this level of ecology:
species
population
ecosystem
biosphere

What is the ultimate source of energy for all ecosystems?
Water
Wind
Organic Compounds
Sunlight

Choose the correct response to this question: What type of population growth is being modeled in the chart?
Exponential growth
Logistic growth
Linear growth
Cyclic growth

I believe that this model is showing ______ growth because ________.
linear; the growth line is an "S" shape and shows the population growing and never stopping
logistic; the growth line is an "S" shape and shows the population reaching capacity and stopping growth
exponential; the growth line is an "J" shape and shows the population growing and never stopping
quadratic; the growth line is an "J" shape and shows the population growing and never stopping

Choose the correct response to this question: What type of population growth is being modeled in the chart?
Exponential growth
Logistic growth
Linear growth
Cyclic growth

I believe that this model is showing ______ growth because ________.
linear; the growth line is an "S" shape and shows the population growing and never stopping
logistic; the growth line is an "S" shape and shows the population reaching capacity and stopping growth
quadratic; the growth line is an "J" shape and shows the population growing over time and never stopping
exponential; the growth line is an "J" shape and shows the population growing over time and never stopping

