
 Worksheets
1st Nine Week Test Review
Total questions: 14
Worksheet time: 11mins
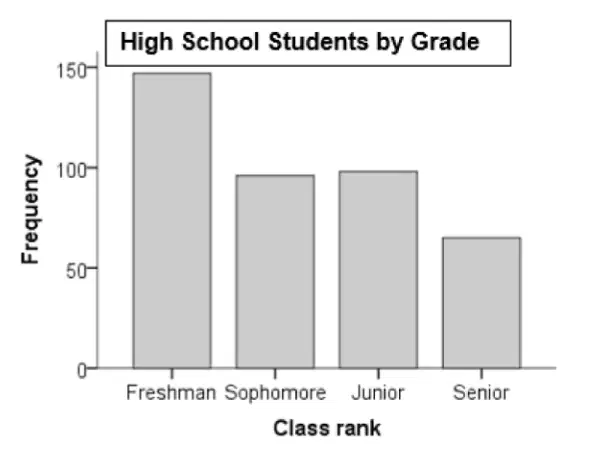
Isabella collected data on the class counts at her school and recorded the grade level of each student. She then made a bar graph of her data. Which statement is true based on Isabella’s bar graph?
The number of Seniors is three times the number of Juniors.
The number of Freshman is more than two times the number of Sophomores.
The number of Sophomores is greater than all the other classes combined.
The number of Freshmen is less than the number of Sophomores and Juniors combined.
Which type of graph would be most appropriate to display data about students’ favorite type of ice cream?
Stem-and-leaf plot
Histogram
Bar Graph
Dot Plot
Determine whether the statement is true or false. If it is false, rewrite it as a true statement. A population is the collection of some outcomes, responses, measurements, or counts that are of interest.
False. A sample is the collection of all outcomes, responses, measurements, or counts that are of interest.
True.
False. A population is the collection of all outcomes, responses, measurements, or counts that are of interest.
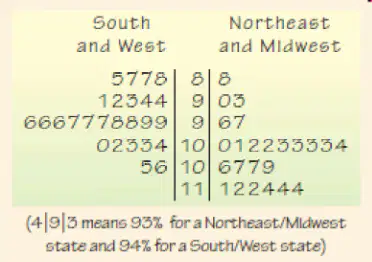
The below stem-and-leaf plot displays the Nest Egg Index - a measure of savings and investments in all 50 states. Which of the following statements about the display is correct?
The distribution of the Nest Egg Index for the Northeast and Midwest is more skewed right than the South and West.
Both distributions are approximately symmetrical.
Both distributions have outliers on the low end.
The distribution of the Nest Egg Index for the Northeast and Midwest is more skewed left than the South and West.
Consider these six data values: 2, 4, 5, 11, 13, 15. Now look at the data set: 82, 84, 85, 91, 93, 95. Without doing any calculations, explain why the standard deviation will be the same even though the mean is obviously different.
The standard deviation will remain the same because the values in the second data set are the same distances away from their mean as the values in the first set.
The standard deviation will remain the same because the distribution of the second set of values is symmetrical.
The standard deviation will remain the same because adjusting values within a data set only affects the center of that data set, not its spread.
The standard deviation will remain the same because adjusting values within a data set only affects the shape of that data set, not its spread.
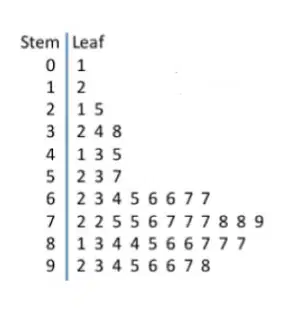
Using the stem and leaf plot below, without doing any calculations, which must be larger – the median or the mean? Explain how you know.
The median will be larger than the mean because the distribution is skewed to the right.
The mean will be larger than the median because the distribution is skewed to the right.
The mean and median are approximately equal because the distribution is symmetric.
The mean will be lower than the median because the distribution is skewed to the left.
You are allowed to choose four numbers from 1 to 10 (inclusive, without repeats). Which of the following is false?
The numbers 4, 5, 6, 7 have the smallest possible standard deviation.
The numbers 1, 2, 3, 4 have the smallest possible standard deviation.
The numbers 1, 5, 6, 10 have the largest possible standard deviation.
The numbers 1, 2, 9, 10 have the largest possible standard deviation.
The numbers 7, 8, 9, 10 have the smallest possible standard deviation.
Which of the following is not a measure of the center of a data set?
lower quartile
mode
median
mean
none of these are measures of center
Which of the following is not a measure of the variability in a data set?
interquartile range
variance
upper quartile
standard deviation
range
An observation is an outlier if it is more than:
1.5*IQR below Q1 and 1.5*IQR above Q3
2*IQR below Q1 and 2*IQR above Q3
2.5*IQR below Q1 and 2.5*IQR above Q3
3*IQR below Q1 and 3*IQR above Q3
Which of the following is an advantage of boxplots?
Boxplots don’t show outliers.
The process for creating a boxplot is not subjective.
Boxplots must be created with technology.
Boxplots can be used with very small data sets.
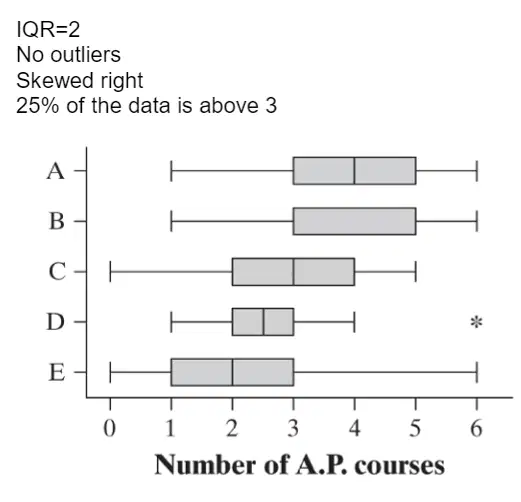
Which of the following is a correct box plot for these data? IQR=2 No outliers Skewed right 25% of the data is above 3
A
B
C
D
E
A data set includes two outliers, one at each end, equidistant from the mean. If both of these outliers are removed, which of the following is a possible result?
Both the mean and Standard Deviation remain unchanged
Both the median and Standard Deviation remain unchanged
Both the Standard Deviation and the variance remain unchanged
Both the mean and median remain unchanged
Both the mean and the Standard Deviation increase
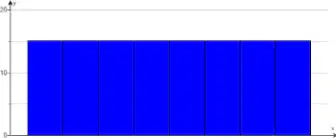
Determine whether the approximate shape of the distribution in the histogram is symmetric, uniform, skewed left, skewed right, or none of these.
Symmetric
Uniform
Skewed left
Skewed right
None of these

