
 Worksheets
Relations/Functions/Qualitative Graphs Graded assignment 24.25
Total questions: 50
Worksheet time: 2hrs 33mins


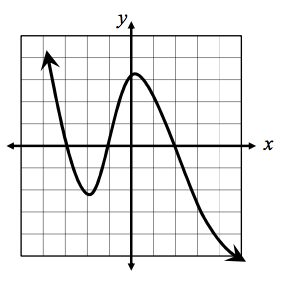


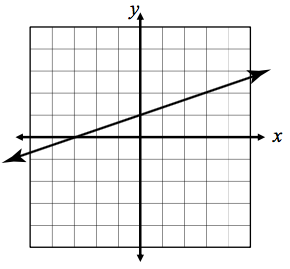
Which mapping diagram is NOT a function?


Which of the following is NOT a function?


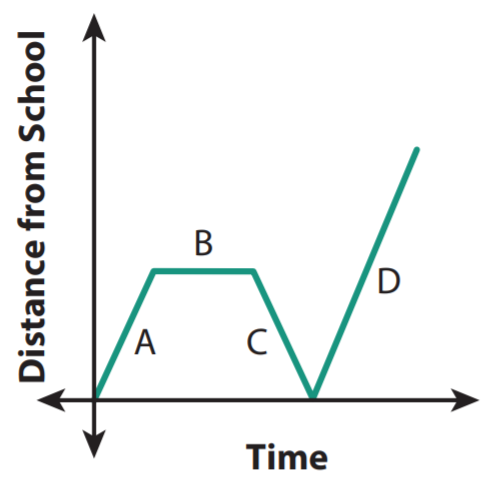
The graph shows Timmy's distance he is as he leaves school one afternoon. What happens in section B?
Timmy is walking back to school because he forgot his math book.
Timmy is talking to a friend and not walking.
Timmy is walking faster home.
Timmy is dancing in the street.
The graph shows Timmy's distance he is as he leaves school one afternoon. What happens in section C? Why is the distance from school decreasing?
Timmy is walking back to school because he forgot his math book.
Timmy is talking to a friend and not walking.
Timmy is walking faster home.
Timmy is dancing in the street.

The graph shows the speed of Mr. Sam driving to work. Which section shows Mr. Sam stopped in traffic?
a.
b.
g.
d.
f.
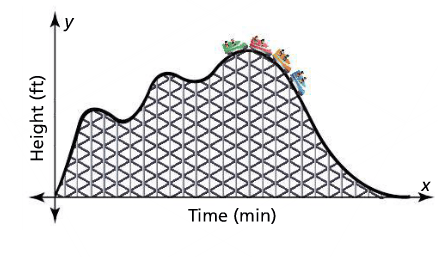
How many descreasing intervals are there?
2
3
4
5
How many increasing intervals are there?
2
3
4
5



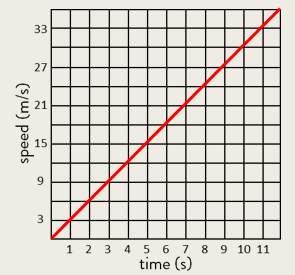
Accelerating gradually
Stopping
Slowing down constantly
Speeding up constantly


The graph shows Mrs. Smith's distance from home as she drives to work. Which section of graph and description match?
Section A: Mrs. Smith leaves home, first driving slowly and then speeding up.
Section B: Mrs. Smith continues driving at a constant speed.
Section C: Mrs. Smith forgot her lunch and had to return home to get it.
Section D: Mrs. Smith drives to work, making a stop along the way.

Choose the the graph that best depicts a man taking a ride on a ferris wheel.
a
b
c
d


A train increases it's speed. It then travels at a constant speed.
A train decreases it speed. It then travels at a constant speed.
A train is going a constant speed. It then decreases it speed until it stops.


Line 1
Line 2
Line 3

Line 1
Line 2
Line 3
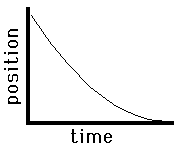


Choose the graph that best depicts a woman climbing a hill at a steady pace and then starts to run down one side.
a
b
c
d

