
 Worksheets
6th grade chapter 5 quiz 1?
Total questions: 17
Worksheet time: 18mins

Examine the table to determine the answer to the question. The data set used in this table includes information related to ______________.
Natural resources
International trade
Population

Examine the table to determine the answer to the question. How much oil is available in Iran?
266 billion barrels
157 billion barrels
149 billion barrels
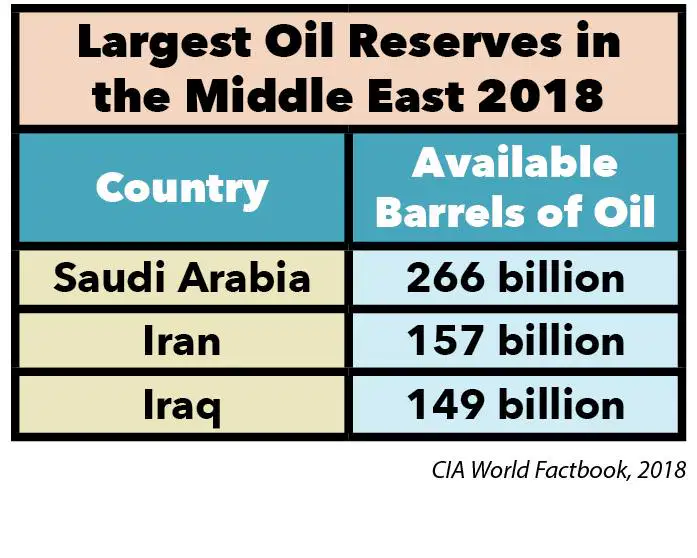
Examine the table to determine the answer to the question. Which country in the Middle East has the largest oil reserves?
Saudi Arabia
Iran
Iraq
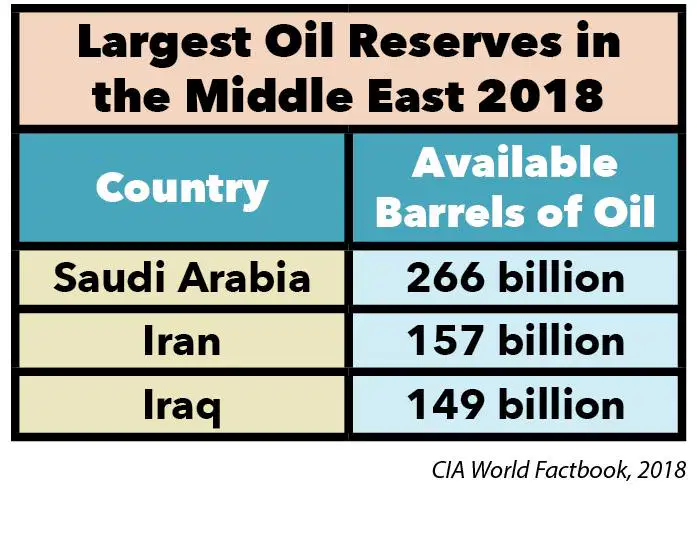
Examine the table to determine the answer to the question. How many barrels of oil do Saudi Arabia, Iran, and Iraq have combined?
570 billion barrels
572 billion barrels
575 billion barrels

Examine the table and compare the data set. Which country has the highest life expectancy?
Austrailia
Japan
South Africa
Turkey
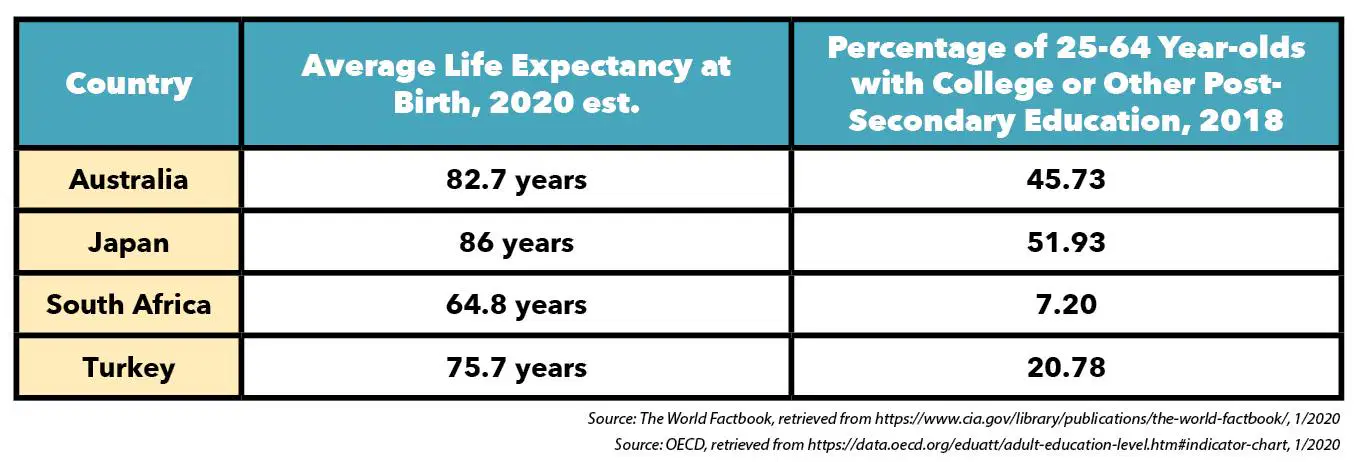
Which country has the highest percentage of 25-64 year old with college or other post secondary education in 2018
Australia
Japan
South Africa
Turkey

The countries on the table that have higher life expectancies also have a higher percentage of people with higher education. Is this true or false?
True
False
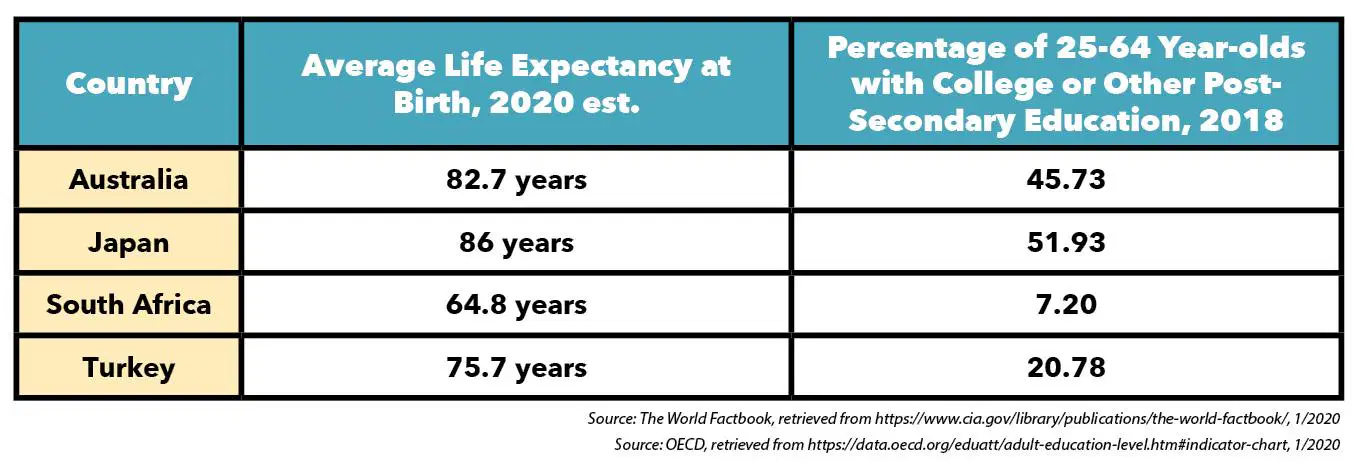
True or False By looking at the table, you can prove why people live longer in Japan than in Australia.
True
False

How is viewing U.S. oil production and imports on a line graph beneficial?
It provides people a visual representation of the trend in oil production and imports over time.
It provides people a side-by-side comparison of oil production and imports.
It provides a visual representation to show that U.S. oil production and imports are independent of each other.
It provides a visual representation to show how the whole of U.S. oil production and imports can be divided into equal parts.

Consider the relationship between U.S. Oil production and imports. Then answer the question. If the United States makes a new law limiting U.S. oil production to 4 million barrels per day, how will this likely affect the amount of oil imported?
The U.S. will lose all of its oil.
The U.S. will not have to make any changes.
The U.S. will need to import less oil from other sources.
The U.S. will need to import more oil from other sources.

Consider the relationship between U.S. Oil production and imports. Then answer the question. Based on the data sets in the table, what could the United States do to decrease the amount of oil that it imports?
Increase Oil production
Decrease Oil production
Stop production

What conclusion can you draw about the relationship between oil production and imports?
As oil production increases, oil imports increase.
As oil production increases, oil imports decrease
As oil production increases, oil imports remain the same.
There is no relationship between oil production and imports.
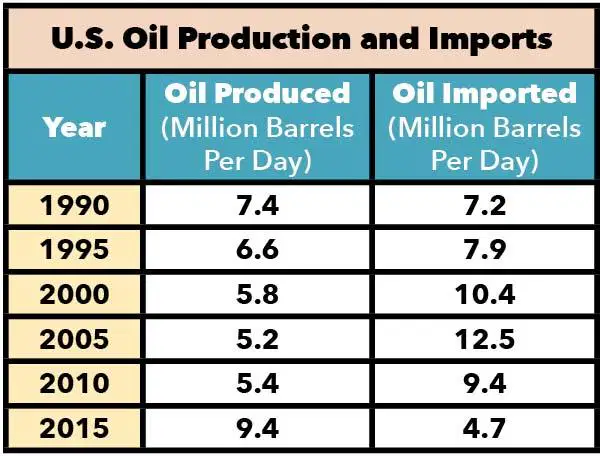
The table shows data for what period of time?
1890-1950
1950-2020
1990-2015
1990-2020
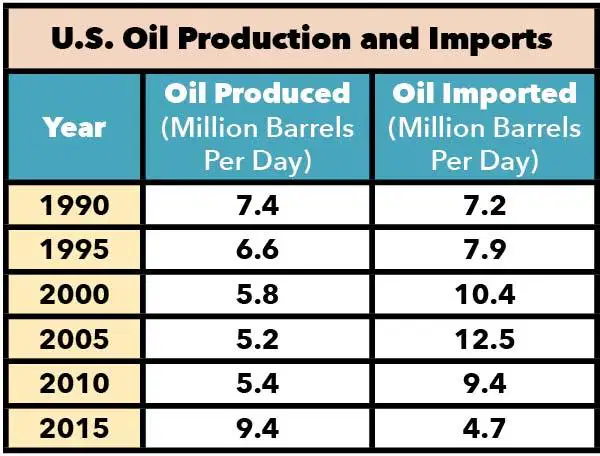
The data sets in this table include information related to each answer except:
industry & production
international trade
natural resources
population
Analyze the table to answer the question. Which country has the smallest oil reserves in the Middle East?
Iraq
Iran
Saudi Arabia
Examine the table to determine the answer to the question. What is the total oil production of the top three oil-producing countries combined?
35 million barrels per day
30 million barrels per day
25 million barrels per day
How confident do we feel to take the test?
0%
25%
50%
75%
100%

