
 Worksheets
Semester Exam Review Part 1
Total questions: 30
Worksheet time: 15mins
Do plants use carbon dioxide?
No, carbon dioxide is solely a waste product of animal respiration.
No, plants release carbon dioxide during photosynthesis.
Yes, all organisms use carbon dioxide during cell respiration.
Yes, carbon dioxide is used during photosynthesis.
Do plants use oxygen?
No, plants produce but do not use oxygen.
Yes, plants use oxygen in photosynthesis.
Yes, plants use oxygen at all times in cell respiration.
Yes, but only at night after photosynthesis has stopped.
Do fish use oxygen?
Yes, oxygen is used 24 hours a day in cell respiration.
Yes, but only at night after photosynthesis has stopped.
Yes, but only in the daytime while photosynthesis is occurring.
No, the animal lives by carrying on fermentation.
Do plants produce carbon dioxide?
Yes, but only at night when the plants can no longer carry on photosynthesis.
Yes, carbon dioxide is produced all the time as a result of cell respiration.
No, carbon dioxide is a waste product of animals only.
No, plants take in only the waste products exhaled by animals.

Based on the diagram below, which of the following terms best fits in each location?
A–excretion, B–cellular respiration
A–transpiration, B–excretion
A–photosynthesis, B–cellular respiration
A–cellular respiration, B–photosynthesis

What is the current approximate deer population in Kentucky?
500,000
800,000
1,000,000
250,000
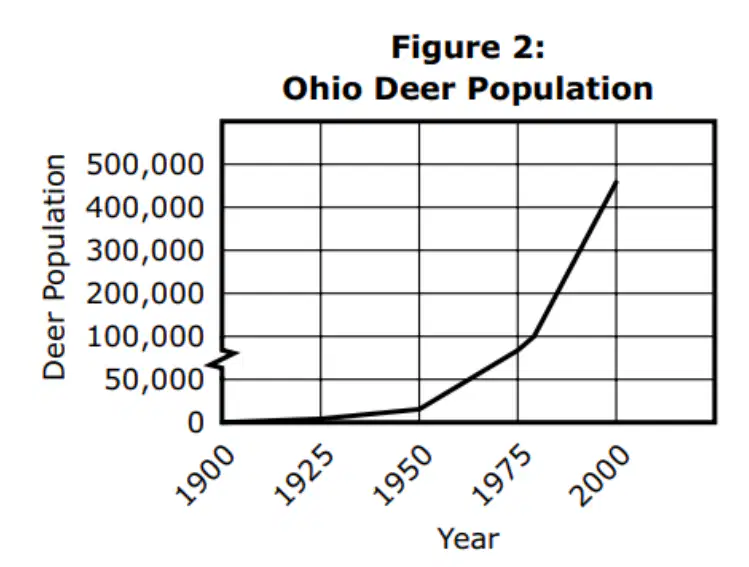
When does the data for the Ohio deer population end?
1995
2000
2005
2010

When does the data for the Connecticut deer population end?
1995
2000
2005
2010

What was the deer population in Ohio in 1975?
200,000
90,000
300,000
400,000

What was the trend in the Kentucky deer population from 1984 to 1991?
Steady increase
Steady decrease
Fluctuating with an overall increase
Fluctuating with an overall decrease

For the Ohio and Connecticut deer populations to demonstrate the same trend as seen in Kentucky after 2005, which one of these would have to be true?
Resource availability must continue to expand faster than the deer population grows in Ohio and Connecticut.
Carrying capacity must be exceeded in Ohio and Connecticut.
The population of predatory species present within the Ohio and Connecticut ecosystems must be stable.
The Ohio and Connecticut ecosystems must remain free of widespread diseases impacting deer.

The graph in Figure 5 shows the deer population change in Kentucky between 1984 and 1991. Which one possible influence might best explain the population change between 1988 and 1989?
Increase in the length of the deer hunting season
Reduction of the predatory coyote population by the Department of Fish and Wildlife
Mild winter conditions that limited fawn losses due to starvation or exposure
An increase in plant growth.

Which organisms in the ecosystem would be indirectly impacted by a change in deer population?
Grass
Decomposers
Insects
Frogs
Ticks

The populations of four species introduced into a new ecosystem are plotted, for the first one hundred days in the graph. Which species was the first to reach the carrying capacity of the ecosystem for that particular kind of organism?
Species 1
Species 2
Species 3
Species 4
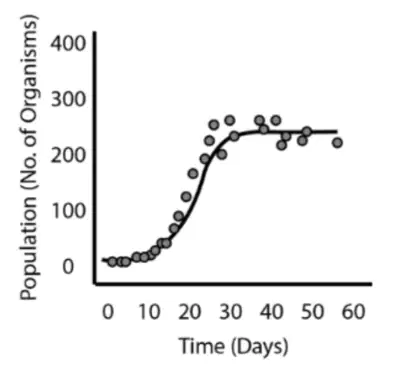
The graph shows the population of an organism introduced to a new environment and how the population changed over sixty days. After the sharp rise, there was a leveling off of the population. What does this indicate?
The life expectancy of the organisms in this population is about thirty days.
This environment has only enough resources to support 250-300 individuals.
This organism needs thirty days to reach maturity before it can reproduce.
This species is unable to reproduce, in any habitat, beyond a population of around thirty individuals.
Is it possible for a species to exceed its carrying capacity in the short term? Which of the following will be the end result for the species?
The population will continue to increase but at a lesser rate.
The population will level out and no longer grow.
The population will crash and experience a sudden decrease.
Other species will increase as well in order to balance the ecosystem.

Based on the information presented in the graph, which of the following MOST LIKELY caused the decline of the moose population?
Poisonous plants killed off many of the moose.
Most of the moose reached old age and died.
Overcrowding increased competition for resources in the moose population.
Hunters killed the wolves.

Which of the following is/are an independent variable in data presented in the graph?
Number of Moose
Number of Wolves
Time
Two of these
All of these

Which of the following is/are a dependent variable in data presented in the graph?
A) Number of Moose
B) Number of Wolves
C) Time
D) Two of these
E) All of these
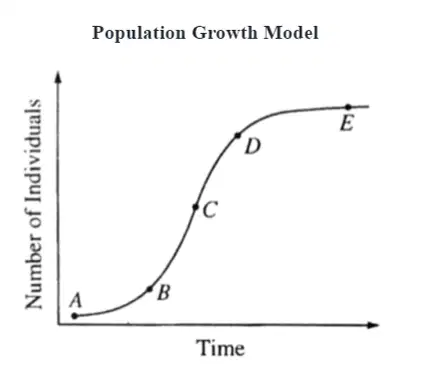
Which letter on the graph represents the carrying capacity?
The area of the graph labeled "A"
The area of the graph labeled "C"
The area of the graph labeled "E"
Carrying capacity cannot be estimated using this graph.
How does the Earth's tilt affect the amount of sunlight received by different regions of the Earth, impacting the rate of photosynthesis in those areas?
Areas receiving more direct sunlight experience higher rates of photosynthesis.
The tilt has no impact on photosynthesis rates.
Areas receiving less direct sunlight experience higher rates of photosynthesis.
The relationship is not well understood.
Pronghorn antelope are herbivores that live in an area that includes much of the western United States. Wild horses and domestic sheep that also live in the area eat the same types of grasses as the pronghorn antelope. Which of the following would most likely increase the carrying capacity for the pronghorn antelope?
a ban on hunting bobcats in the area
a new law that allows more sheep to be raised in the area
a dry winter that decreases the number of plants that grow in the area
a viral disease that decreases the population size of the wild horses in the area
Photosynthesis and cellular respiration both involve the use and release of gases. Which statement correctly identifies the role of gases in the two processes?
Photosynthesis and cellular respiration both use carbon dioxide and release oxygen.
Photosynthesis and cellular respiration both use oxygen and release carbon dioxide.
Cellular respiration uses oxygen and releases carbon dioxide, while photosynthesis uses carbon dioxide and releases oxygen.
Cellular respiration uses carbon dioxide and releases oxygen, while photosynthesis uses oxygen and releases carbon dioxide.
Unlike photosynthesis, cellular respiration occurs in
animals only.
plants only.
all living things but plants.
all living things.

What would happen if the population of the bird species shown in the ecosystem above were to suddenly decrease?
The grass population would increase.
The fish population would increase.
The fish would occupy the birds' niche.
The grass and fish would compete for resources.

What role do trees play in the environment according to the diagram?
Trees decrease humidity and provide shade.
Trees increase humidity, hold the soil, and their roots absorb rainwater.
Trees provide carbon dioxide and absorb oxygen.
Trees are used for timber and paper production.

Which country has the highest water consumption per day per person according to the chart?
Belgium
Canada
U.S.
Germany
What is the primary factor that determines the carrying capacity of an ecosystem for a particular species?
All of the above
Climate conditions
Presence of predators
Availability of food resources
Which of the following processes is directly responsible for the release of oxygen into the atmosphere?
Fermentation
Photosynthesis
Decomposition
Cellular respiration
How does an increase in the population of herbivores affect the carrying capacity of an ecosystem?
It increases the carrying capacity by providing more food for predators.
It decreases the carrying capacity by reducing available plant resources.
It has no effect on the carrying capacity.
It stabilizes the carrying capacity by balancing the ecosystem.

