
 Worksheets
MVP 2 Review 25-26
Total questions: 20
Worksheet time: 3600secs

4.5
2.7
-7.5
-8.5
Which graph represents a NONLINEAR function?


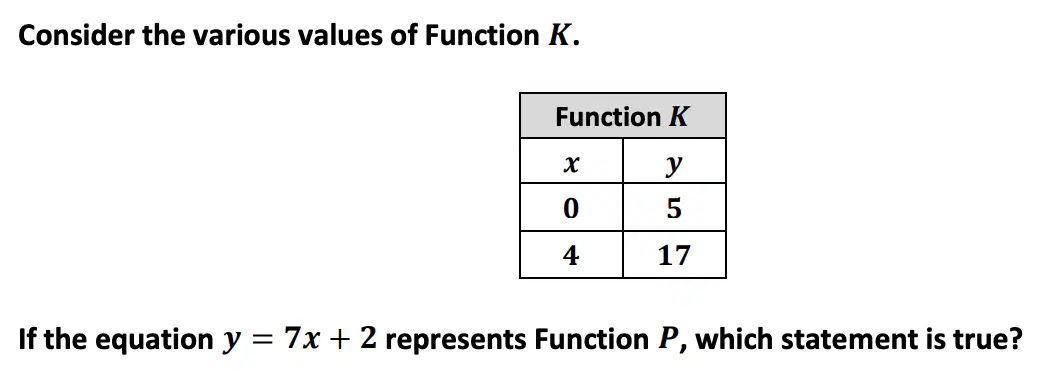
Function K has a greater slope and y-intercept than Function P.
Function K has a greater slope but a smaller y-intercept than Function P.
Function K has a smaller slope and y-intercept than Function P.
Function K has a smaller slope but greater y-intercept than Function P.
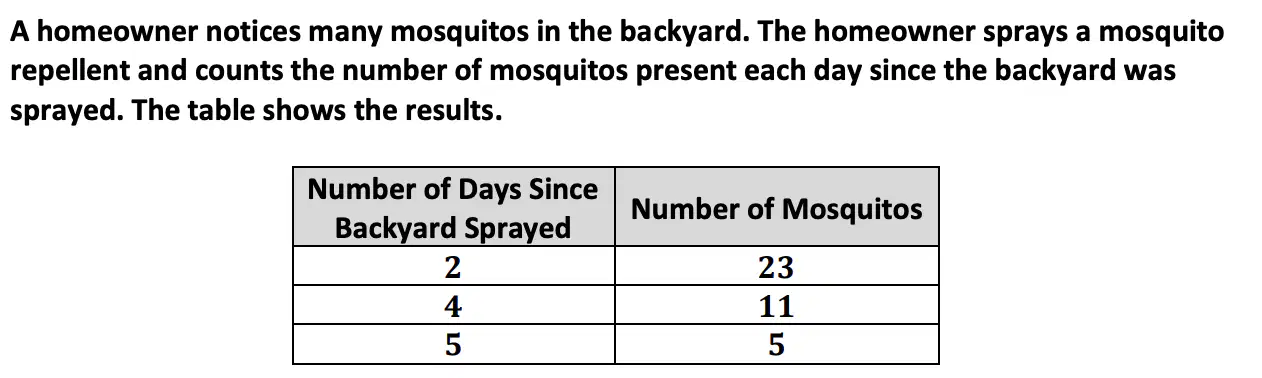
Which statement about the graph of the line that models the scenario is true?
The slope of the lines is -6, which represents a decrease of 6 mosquitos every day.
The slope of the line is -6, which represents the 6 mosquitos present before the backyard was sprayed.
The slope of the line is -12, which represents a decrease of 12 mosquitos every day.
The slope of the line is -12, which represents the 12 mosquitos present before the backyard was sprayed.

5x - y = 7
5x - y = 1
x - 5y = 35
x - 5y = 5

Which equations represents t, the temperature of the coffee in degrees Fahrenheit, after it sits for m minutes?
t = -30m + 185
t = -15m + 185
t = 15m + 185
t = 30m + 185

Which statement is true?
The linear model describes the data well because it is located below the majority of the points.
The linear model describes the data well because it minimizes the distance between the model and the points.
The linear model does not describe the data well because it does not connect the first and last points.
The linear model does not describe the data well because it does not minimize the distance between the model and the points.

Each box of bagels costs $3.00, and each box of donuts costs $5.00.
Each box of bagels costs $4.00, and each box of donuts costs $6.00.
Each box of bagels costs $5.00, and each box of donuts costs $3.00.
Each box of bagels costs $7.00, and each box of donuts costs $2.50
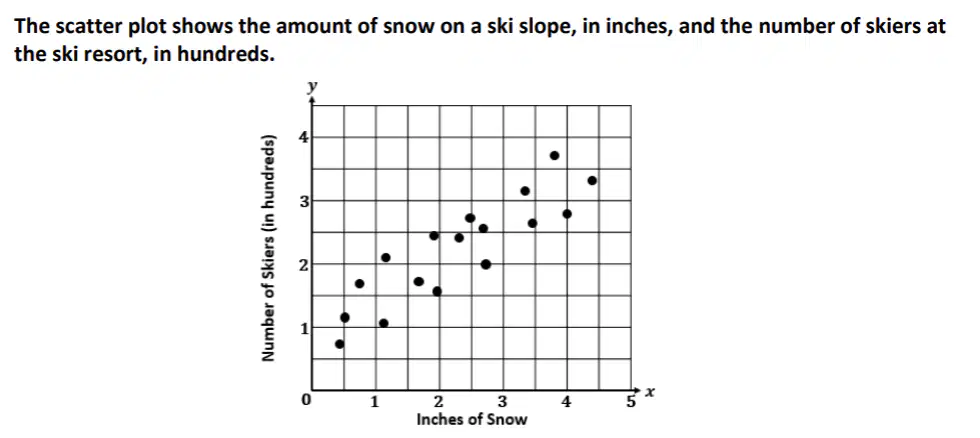
Which line best fits the scatter plot?


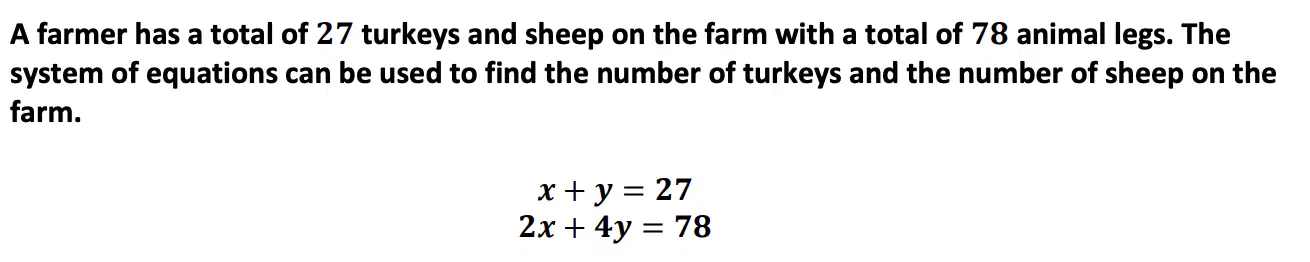
Given that a sheep has more legs than a turkey, what does the solution (15, 12) represent?
For every sheep, there are 15 turkeys.
For every turkey, there are 15 sheep.
There are 15 sheep and 12 turkeys on the farm.
There are 15 turkeys and 12 sheep on the farm.
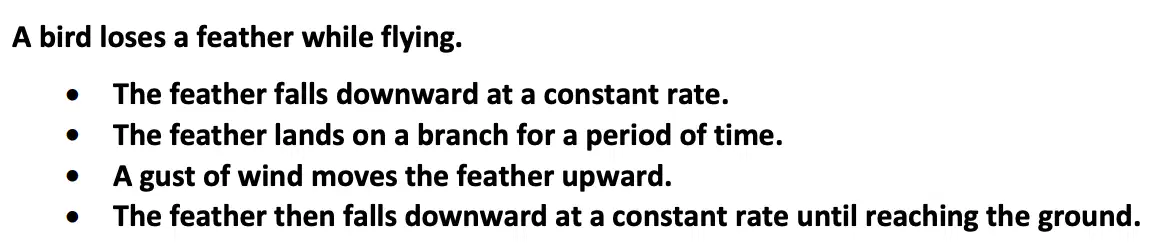
Which graph best represents the height of the feather since the bird lost it?


Which statement is true?
Overall, there is a negative, linear association between 𝑥 and y
Overall, there is a negative, nonlinear association between 𝑥 and y.
Overall, there is a positive, linear association between 𝑥 and y.
Overall, there is a positive, nonlinear association between 𝑥 and y.

Which statement best describes the association between the number of tickets sold at the theme park and the hours of rain each day?
As the hours of rain each day increases, the number of tickets sold decreases.
As the hours of rain each day increases, the number of tickets sold increases.
As the hours of rain each day increases, the number of tickets sold remains the same.
There is no apparent association between hours of rain in a day and number of tickets sold.
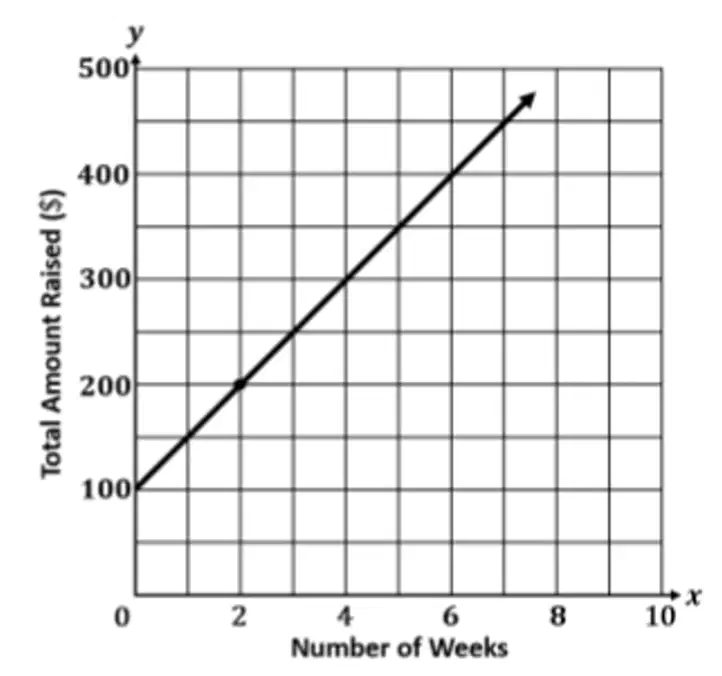
The graph represents the relationship between the total amount of money the student council raises, y, in dollars, x weeks after the student council starts a fundraiser. Which statement about the relationship is true?
The student council initially raises $50.
The student council initially raises $100.
The student council raises $25 per week.
The student council raises $100 per week.
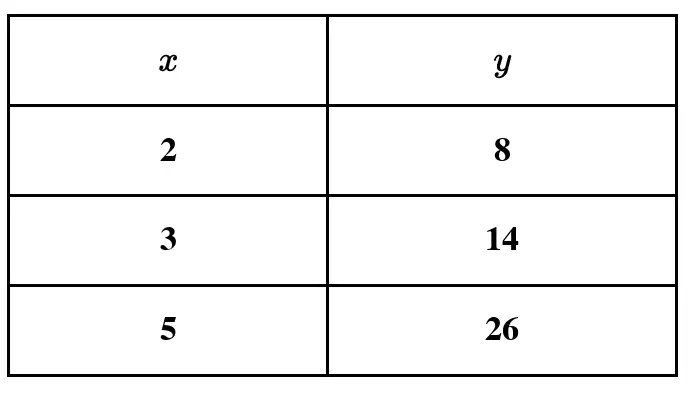
Consider the linear function represented by the table. Which equation best represents the relationship between x and y in the table?
y = 3x + 2
y = 6x - 4
y = 6x + 2
y = 8x - 4
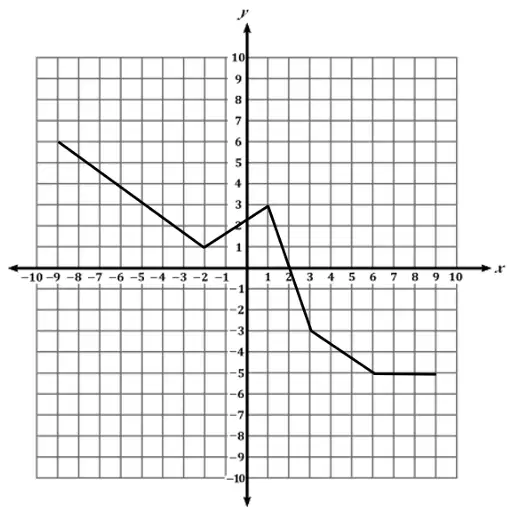
Which statement is true?
When 𝑥 is between −2 and 1, the function is decreasing, and when 𝑥 is between 3 and 6, the function is decreasing.
When 𝑥 is between −2 and 1, the function is decreasing, and when 𝑥 is between 3 and 6, the function is increasing.
When 𝑥 is between −2 and 1, the function is increasing, and when 𝑥 is between 3 and 6, the function is decreasing.
When 𝑥 is between −2 and 1, the function is increasing, and when 𝑥 is between 3 and 6, the function is increasing.

Consider the graph. Which statement is true?
The graph represents a linear function because the graph intersects both axes.
The graph represents a linear function because the graph is a straight line.
The graph represents a nonlinear function because the graph does not intersect the origin.
The graph represents a nonlinear function because the graph is not a straight line.

In a random survey, pet owners were asked if their dogs and cats were mixed breed or purebred. It was found that out of 𝟏𝟒 dogs and 𝟏𝟕 cats, 𝟑 of the dogs were purebred, and 𝟏𝟓 of the cats were mixed breed. Based on the data, what value of 𝒙 correctly completes the two-way table?
3
11
12
28
Which graph best represents a system of equations that has no solution?


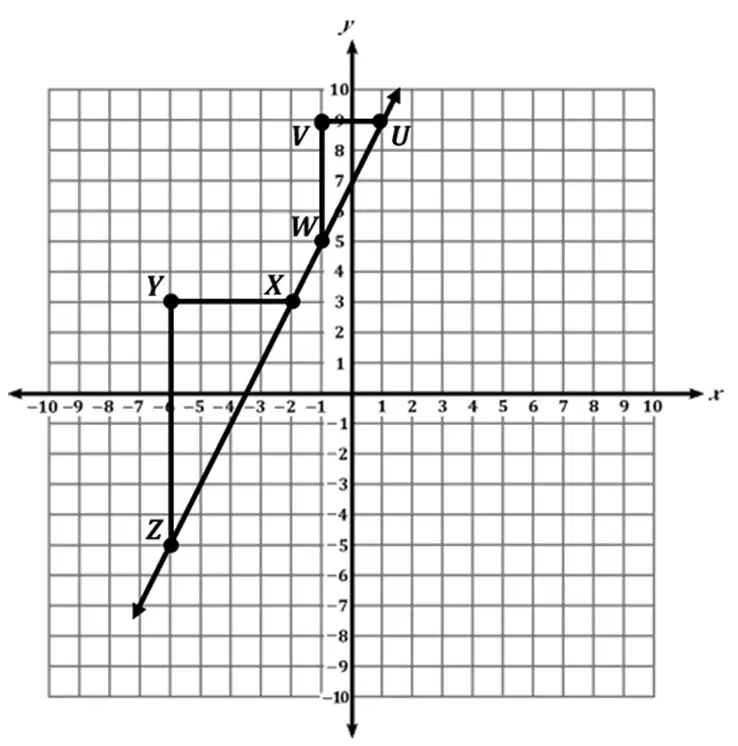
Consider the figure. Which statement is true?
The slope of line segment UW is equal to the slope of line segment XZ because the ratio of the vertical to horizontal change between points U and W is the same as the ratio of the vertical to horizontal change between points X and Z.
The slope of line segment UW is greater than the slope of line segment XZ because the distance between points V and W is greater than the distance between points Y and Z.
The slope of line segment UW is greater than the slope of line segment XZ because the ratio of the vertical to horizontal change between points U and W is greater than the ratio of the vertical to horizontal change between points X and Z.
The slope of line segment UW is less than the slope of line segment XZ because the distance between points V and W is less than the distance between points Y and Z.

