
 Worksheets
Interpreting Data
Total questions: 10
Worksheet time: 25mins
Name
Class
Date
1.
Favorite food
a)
categorical
b)
numerical
c)
data that changes over time
2.
Total family members
a)
categorical
b)
numerical
c)
data that changes over time
3.
Favorite color
a)
categorical
b)
numerical
c)
data that changes over time
4.

Which two types of websites combined received the same number of votes as the type of website with the greatest number of votes?
a)
Videos
b)
Games & Music
c)
News & Sports
d)
Games & News
5.
What is your favorite sport?
a)
Categorical
b)
Numerical
6.

How many students spent 7 hours doing homework that week?
a)
1
b)
3
c)
5
d)
6
7.
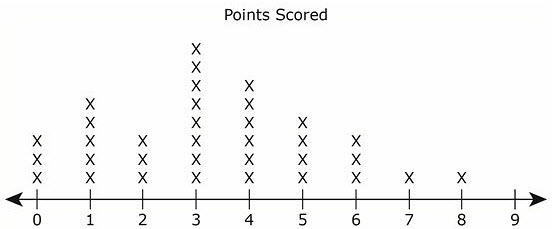
The dot plot below shows the points scored by players in a basketball game.
What is the difference between the number of players who scored fewer than 4 points and the number of players who scored more than 4 points?
What is the difference between the number of players who scored fewer than 4 points and the number of players who scored more than 4 points?
a)
4 players
b)
10 players
c)
13 players
d)
15 players
8.

As a farmer, you will need to hire additional people to help harvest the crops. What month will you need the most help?
a)
February
b)
May
c)
June
d)
March
9.

How much does it cost to have your lawn mowed for 2 hours?
a)
$16
b)
$17
c)
$18
d)
$19
10.

How many cars did Mr. Smith sell during the month of September? (Count days a car was sold only.)
a)
20 cars
b)
22 cars
c)
60 cars
d)
66 cars
100 %

