
 Worksheets
Test Review 12.16
Total questions: 22
Worksheet time: 24mins

Who has the greater rate of change?
CJ has a greater rate of change with 6.5
Holland has a greater rate of change with 6
CJ has a greater rate of change with 2/13
They have the same rate of change.

Who has the greater slope?
Tyler has the greater slope with 2/3
Aubri has the greater slope with 3/2
Tyler has the greater slope with 3/2
They have the same slope.

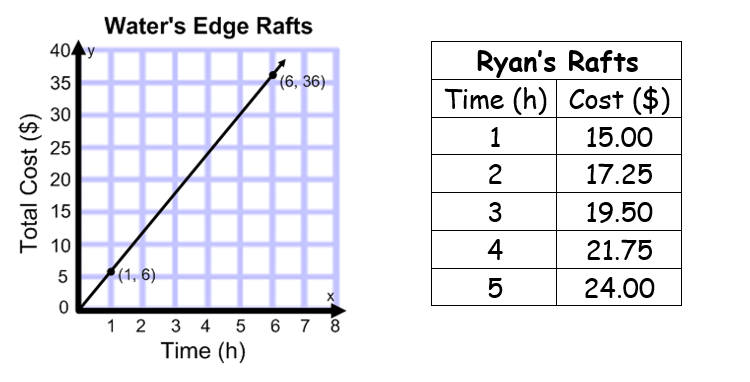
Which company shows a greater slope?
Water's Edge Rafts
Ryan's Rafts

Who has the greater y-intercept?
Tyler has the higher y-intercept.
Aubri has the higher y-intercept.
They have the same y-intercept


Equation A: y = 2x + 3
Equation B: y = 3x - 3
Which equation has a steeper slope?
Equation A
Equation B
They have the same slope
Equation B: y = 1/2x + 1
Which equation has a higher y intercept?

Function A is represented by the table.
Function B is represented by the equation y = 3x - 4.
What is the rate of change (slope) for Function A?
2
1/2
3
-2

What is the rate of change (cost per hour) to rent a raft from Water's Edge Rafts?
5
30
6/36
6

Which company charges more per hour?
Water's Edge Rafts
Ryan's Rafts
Neither. They have the same rate of change.
There is not enough information to answer this question.

Function A is represented by the equation.
Function B is represented by the graph.
What is Function B's rate of change?
2/3
-1
1
3/2

What is the type of correlation?
Negative
no association
positive

What type of correlation does this graph have?
positive
negative
none
all of the above

What type of correlation does this graph show?
Positive
negative
none
all of the above

What type of correlation does this scatter plot show?
positive linear association
negative linear association
no association
nonlinear association

What type of correlation does this scatter plot represent?
positive linear association
negative linear association
no association
nonlinear association
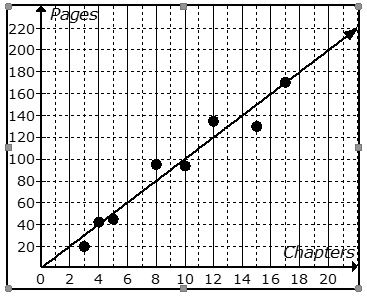
The scatter plot shows the relationship between the number of chapters and the total number of pages for several books. Use the trend line to predict how many chapters would be in a book with 140 pages.
12 chapters
19 chapters
14 chapters
21 chapters
You are analyzing a scatter plot that has a negative correlation. What is true of the of the x and y values?
As x increases, y decreases
As x increases, y increases
As x decreases, y decreases

Which graph shows the line of best fit?
A
B
C
D

