
 Worksheets
6 Stats Effect Size and Statistical Power
Total questions: 29
Worksheet time: 15mins
What are the two main categories of research?
Relationships between variables and observations of variance.
Differences between groups (mean scores) and relationships between variables.
Statistical tests and data visualization techniques.
Group comparisons and standard deviation analyses.
What the fuck is a p-value?
It represents the likelihood that we would see our results, or more extreme, if there were really no difference in reality (if the null was true). So, a low p-value means it would be unlikely to have just found these results by chance if there was really no difference in reality.
I don't want to make things more confusing with other incorrect answers, just read that and understand it.
Why is overemphasis on statistical significance problematic in psychology?
It reduces the variability within datasets.
It leads to publication bias and neglect of practical significance.
It inflates the effect sizes observed in studies.
It ensures results are always replicable.
What is effect size?
A measure of the variability of data in a sample.
A statistical test for determining p-values.
A measure of the magnitude of a difference or relationship.
A description of the sampling error in an experiment.
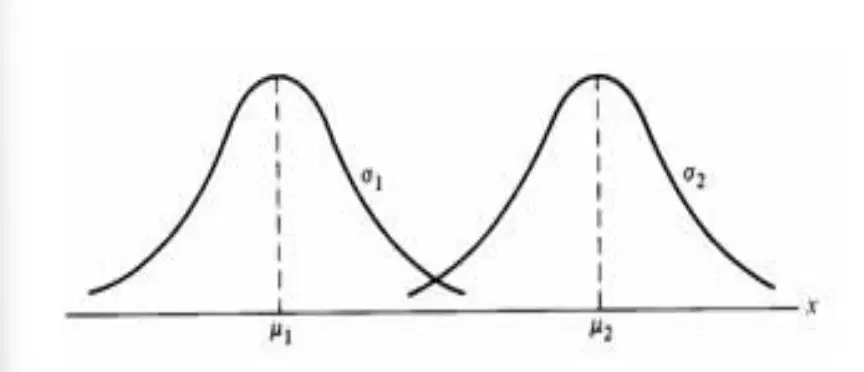
The less overlap there is between 2 distributions...
...the greater the effect size.
...the lesser the effect size.
How are effect size, sample size, and power related?
They operate independently in most studies.
They are interconnected, and changing one impacts the others.
They only interact when the alpha level is adjusted.
They have no impact on Type 1 or Type 2 errors.
What does Cohen’s d measure?
The proportion of shared variance between two variables.
The probability of rejecting a null hypothesis.
Effect size. Technically: the standardized difference between two means.
The variability within a single sample.
Cohen's d is expressed in terms of Standard Deviations.
If the mean of one group was found to be 2 SDs above the mean of another, what would the Cohen's d value be?
2
0.2
0.02
0.002
What are the general guidelines for interpreting Cohen’s d?
Minimal (0-0.1), moderate (0.1-0.3), and large (0.4 or greater).
Small (0-0.4), medium (0.5-0.8), and large (0.8 or greater).
Small (0-0.2), moderate (0.3-0.6), and large (0.7 or greater).
Weak (0-0.2), strong (0.3-0.5), and very strong (0.6 or greater).
What is the coefficient of determination?
The range of plausible population values.
The proportion of variance shared between two variables (calculated as r²).
The variability in standard deviations for a dataset.
The probability of rejecting a false null hypothesis.
How can you calculate the percentage of shared variance from r?
Square the r value and divide by the total number of observations.
Take the square root of the r value and multiply by 100.
Square the r value and multiply by 100.
Multiply the r value by the standard deviation.
What does statistical power measure?
The range of standard deviations in a dataset.
The probability of correctly rejecting a false null hypothesis.
The confidence interval for a population parameter.
The proportion of shared variance in a sample.
How is power related to Type 2 errors?
High power increases the probability of a Type 2 error.
High power reduces the probability of a Type 2 error.
High power eliminates Type 2 errors entirely.
Power and Type 2 errors are unrelated.
What are the three main parameters affecting power?
Effect size, sample size, and alpha level.
p-value, standard deviation, and confidence intervals.
Mean, median, and mode.
Variance, shared variance, and effect size.
Which parameter is typically within the researcher’s control when designing a study?
Effect size.
Sample size.
Alpha level.
Confidence intervals.
Why is conducting a power analysis before a study important?
It increases the likelihood of achieving statistical significance.
It determines what the minimum sample size should be.
It eliminates the risk of a Type 1 error.
It ensures confidence intervals remain stable.
What does a power of 0.80 imply?
A 20% probability of detecting an effect if it exists.
An 80% probability of detecting an effect if it exists.
That the Type 1 error rate has been minimized.
That the confidence interval will always include the population mean.
Why can small sample sizes result in Type 2 errors?
They inflate the standard deviation of the sample mean.
They lead to low power, making it difficult to differences, meaning it is more likely to say there is no difference even it there is one.
They increase the likelihood of a Type 1 error.
They reduce the p-value for rejecting the null hypothesis.
Why can large sample sizes result in Type 1 errors?
They decrease variability in the sample.
They reduce the standard error of the mean.
They can detect trivial effects as statistically significant due to extremely high power.
They affect the coefficient of determination.
What is the practical significance of a study’s findings?
The range of plausible values for the population parameter.
The real-world importance or impact of the observed effect.
The probability of rejecting a false null hypothesis.
The proportion of shared variance between two variables.
What is the typical threshold for statistical power in psychological research?
0.90 or 90%.
0.70 or 70%.
0.95 or 95%.
0.80 or 80%.
What should a power analysis consider when determining sample size?
The desired power, alpha level, and estimated effect size.
The standard deviation, p-value, and sample variance.
The shared variance, mean, and effect size.
The confidence interval, range, and effect size.
Determine the Coefficient of determination if r=.45
2.25%
22.5%
0.25%
20.25%
A type 1 error is... and a type 2 error is...
Type 1 - False positive; Type 2 - False negative
Type 1 - False negative; Type 2 - False positive
When we are looking at the difference between means, the effect size is the difference between them. However, when we are looking at the relationship between variables, the effect size is about the proportion of overlap between them (or shared variance).
That's right. So, the greater the overlap between means of two groups, the lower the effect size. But the greater the overlap between scores of two variables, the greater the effect size.
X
What did Cohen recommend for interpreting the r value?
<.30 (small), .30 - .49 (med), .50 - 1 (large)
< .10 (small), .10 - .29 (medium), .30 - 1.0 (large).
What is the alpha level set by the field?
p < 0.05
p < 5
p < 0.5
You want to conduct a power calculation, but you do not know the effect size. What can you do?
Determine what the minimum clinically important effect size would be.
X
Which is not a reason to conduct a power analysis before your study?
Ethics - so as not to recruit more participants than needed
Practicality - Can you realistically recruit enough people
Budget - to justify your budget to funders
Interpretation of findings - allows you to anticipate why type of error might occur

