Worksheets
Construct and Interpret Scatter Plots
Total questions: 15
Worksheet time: 18mins


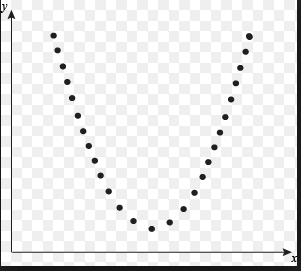
Describe the association for the graph.
Linear and Positive
Linear and Negative
Non-Linear and Positive
Non-Linear and Negative
Non-Linear and No Association


Describe the association for the scatterplot based on data plotted.
As the weeks increase, the amount of money on the gift card increases.
As the weeks decrease, the amount of money on the gift card increases.
There is no relationship between the time in weeks and the amount of dollars.
As the weeks increase, the amount of money on the gift card decreases.

Mrs. Collins made a scatterplot to show the relationship between the number of absences and a student’s final exam score. Based on this scatterplot, a student with 12 absences should get approximately what score on the final exam?
60
92
70
76
The size of a dog and the amount of dog food needed
Positive correlation
Negative correlation
No correlation

Identify any outliers.
Outlier at x = 18
Outlier at x = 12
Outlier at x = 6
There aren't any outliers in this graph.