
 Worksheets
Probability Using Venn Diagrams
Total questions: 10
Worksheet time: 8mins

A pizza parlor surveyed 110 customers to determine their favorite pizza topping or combination of toppings. The results are shown below. Find P(Mushrooms). Reduce the fraction.
103
11039
5526
554
A pizza parlor surveyed 110 customers to determine their favorite pizza topping or combination of toppings. The results are shown below. Find P(Sausage and Pepperoni). Reduce the fraction.
554
1109
556
5541
A pizza parlor surveyed 110 customers to determine their favorite pizza topping or combination of toppings. The results are shown below. Find P(Mushrooms or Pepperoni).
11064
11073
11082
11012
A pizza parlor surveyed 110 customers to determine their favorite pizza topping or combination of toppings. The results are shown below. Find P(not picking any of the toppings). Reduce the fraction.
554
1109
111
556
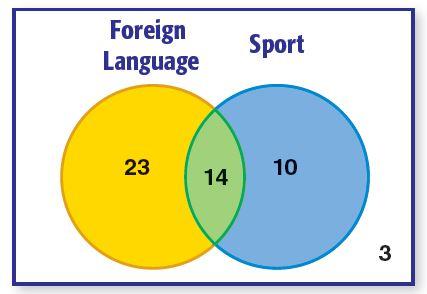
If chosen at random, what is the probability of choosing a student who takes a foreign language, given they participate in a sport? (Answer is in reduced form.)
14/27
7/12
23/47
37/47

The Venn diagram shows which sports are played by a class of students. How many students are in the class?
20
25
30
35
The Venn diagram shows which sports are played by a class of students. How many students are taking tennis?
6
11
25
30


