
 Worksheets
Scatter Plots Association and Trends
Total questions: 56
Worksheet time: 1hrs 14mins
Name
Class
Date
1.

Which scatter plot shows a linear relationship between x and y?
a)
Graph A
b)
Graph B
c)
Graph C
d)
Graph D
2.

What type of association does this scatter plot show?
a)
positive linear association
b)
negative linear association
c)
no association
d)
nonlinear association
3.
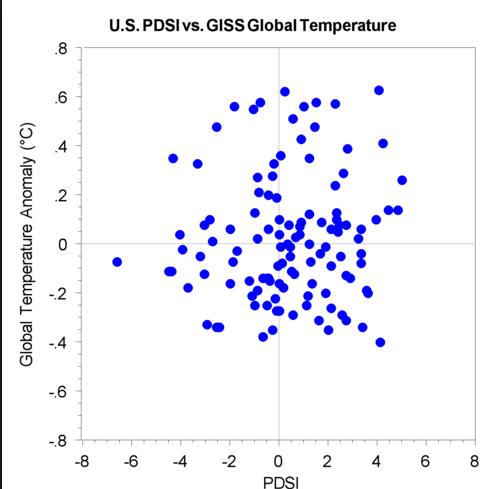
What type of association does this scatter plot represent?
a)
positive linear association
b)
negative linear association
c)
no association
d)
nonlinear association
4.

What type of association does this scatter plot represent?
a)
positive linear association
b)
negative linear association
c)
no association
d)
nonlinear association
5.

The following scatter plot shows Pam's training as she prepares to run a 6 mile race at the end of the month. Which of the following would be a reasonable approximation for the length of time it would take for her to run 6 miles?
a)
A. 50 min
b)
B. 80 min
c)
C. 45 min
d)
D. 60 min
6.
You are analyzing a scatter plot that has a negative correlation. What is true of the of the x and y values?
a)
As x increases, y decreases
b)
As x increases, y increases
c)
As x decreases, y decreases
7.

About how many male math teachers were there in 2006?
a)
15
b)
30
c)
35
d)
45
8.

The scatter plot shows the relationship between the number of chapters and the total number of pages for several books. Use the trend line to predict how many chapters would be in a book with 180 pages.
a)
12 chapters
b)
15 chapters
c)
18 chapters
d)
21 chapters
9.

Mrs. Collins made a scatterplot to show the relationship between the number of absences and a student’s final exam score. Based on this scatterplot, a student with 6 absences should get approximately what score on the final exam?
a)
65
b)
92
c)
70
d)
76
10.

What is the type of association?
a)
Negative
b)
no association
c)
positive
11.

What type of association does this graph have?
a)
positive
b)
negative
c)
none
d)
all of the above
12.
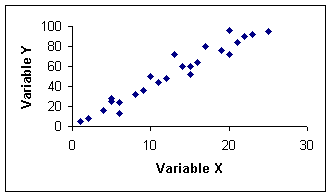
What type of association does this graph have?
a)
positive
b)
negative
c)
none
d)
all of the above
13.

What type of association does this graph show?
a)
Positive
b)
negative
c)
none
d)
all of the above
14.

What type of association does this graph have?
a)
positive
b)
negative
c)
none
d)
all of the above
15.
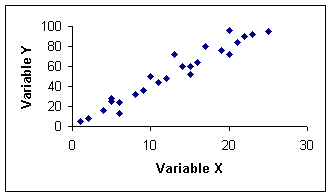
What type of association does this graph have?
a)
positive
b)
negative
c)
none
d)
all of the above
16.

What type of association does this graph have?
a)
positive
b)
negative
c)
none
d)
all of the above
17.

The following scatter plot shows Pam's training as she prepares to run a 6 mile race at the end of the month. Which of the following would be a reasonable approximation for the length of time it would take for her to run 6 miles?
a)
A. 50 min
b)
B. 80 min
c)
C. 45 min
d)
D. 60 min
18.
What type of correlation (association)?
The outside temperature and the amount of layers you wear.
The outside temperature and the amount of layers you wear.
a)
Positive correlation
b)
Negative correlation
c)
No correlation
d)
All of the above
19.
The number of siblings you have and your weight.
a)
Positive correlation
b)
Negative correlation
c)
No correlation
d)
All of the above
20.

Based on the graph, if Joe earned $400, how many hours did he work?
a)
25 hours
b)
35 hours
c)
45 hours
d)
15 hours
21.

What type of correlation does this scatter plot represent?
a)
positive linear correlation
b)
negative linear correlation
c)
no correlation
d)
nonlinear correlation
22.

What type of correlation does this graph have?
a)
positive
b)
negative
c)
none
d)
all of the above
23.
As x increases, y decreases.
a)
no correlation
b)
negative correlation
c)
correlation coefficient
d)
positive correlation
24.
What is a scatter plot?
a)
A graph that shows the relationship of two data sets.
b)
A graph drawn using rectangular bars to show how large each value is.
c)
A graph that shows information that is connected in some way.
d)
A graph that shows data changing over time.
25.

What is the type of correlation?
a)
Negative
b)
no association
c)
positive
26.

What type of correlation does this graph have?
a)
positive
b)
negative
c)
none
d)
all of the above
27.

What type of correlation does this graph have?
a)
positive
b)
negative
c)
none
d)
all of the above
28.

What type of correlation does this graph show?
a)
Positive
b)
negative
c)
none
d)
all of the above
29.

What type of correlation does this scatter plot show?
a)
positive linear association
b)
negative linear association
c)
no association
d)
nonlinear association
30.

1. Mrs. Collins made a scatterplot to show the relationship between the number of absences and a student’s final exam score. Based on this scatterplot, a student with 6 absences should get approximately what score on the final exam?
a)
65
b)
92
c)
70
d)
76
31.
Which scatter plot shows a linear relationship between x and y?
a)
Graph A
b)
Graph B
c)
Graph C
d)
Graph D
32.

What is the type of association?
a)
Negative
b)
no association
c)
positive
33.

What type of association does this graph have?
a)
positive
b)
negative
c)
none
d)
all of the above
34.

What type of correlation does this graph have?
a)
positive
b)
negative
c)
none
d)
all of the above
35.

Which statement below accurately represents the graph?
a)
$100 is earned for each hour worked
b)
$100 is earned for every 2 hours worked
c)
$200 is earned for every 2 hours worked
d)
$200 is earned for every 3 hours worked
36.

What is the type of correlation?
a)
Negative
b)
no association
c)
positive
37.

Which scatter plot shows a linear relationship between x and y?
a)
Graph A
b)
Graph B
c)
Graph C
d)
Graph D
38.

Does this graph contain an outlier?
a)
Yes
b)
No
c)
Not enough information
39.

About how many male math teachers were there in 2006?
a)
15
b)
30
c)
35
d)
45
40.

1. Mrs. Collins made a scatterplot to show the relationship between the number of absences and a student’s final exam score. Based on this scatterplot, a student with 6 absences should get approximately what score on the final exam?
a)
65
b)
92
c)
70
d)
76
41.
What type of correlation does this graph show?
a)
Positive
b)
negative
c)
none
d)
all of the above
42.

What type of correlation does this graph have?
a)
positive
b)
negative
c)
none
d)
all of the above
43.

Which sentence describes the relationship shown on this scatterplot?
a)
As the temperature decreases, the visitors increase.
b)
As the temperature increases, the number of visitors increases.
c)
As the visitors increase, the temperature decreases.
d)
No correlation
44.
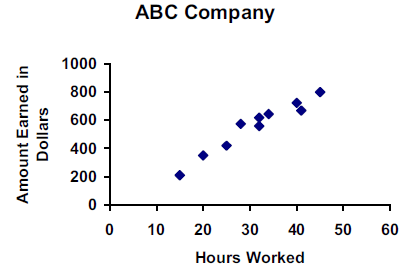
If Joe worked 30 hours, how much is he expected to earn?
a)
$600
b)
$200
c)
$1000
d)
$800
45.

If Gold's Gym paid $250 for each TV, how many did they buy?
a)
35
b)
30
c)
45
d)
20
46.
The number of siblings you have and your weight.
a)
Positive correlation
b)
Negative correlation
c)
No correlation
47.
What type of correlation (association)?
The outside temperature and the amount of layers you wear.
The outside temperature and the amount of layers you wear.
a)
Positive correlation
b)
Negative correlation
c)
No correlation
48.

Which is the best description of the data shown on this graph?
a)
nonlinear, negative trend
b)
nonlinear, positive trend
c)
linear, negative trend
d)
linear, positive trend
49.
Name the correlation in this sentence: The average temperature in a city and the number of speeding tickets in the city.
a)
Lots of Correlation
b)
Negative Correlation
c)
No Correlation
d)
Positive Correlation
50.
Name the correlation in this sentence: The number of people in an audience and ticket sales.
a)
No Correlation
b)
Positive Correlation
c)
Negative Correlation
d)
Lots of Correlation
51.
A collection of points that are close together is called a(n) ...
a)
outlier
b)
cluster
c)
bivariate
d)
association
52.

If the debate team plans to practice for 6 hours, how many debates should they win?
a)
20
b)
16
c)
24
d)
28
53.

What is the independent variable?
a)
Precipitation
b)
Cucumber Yield
c)
kg
54.

What happened during O to A point?
a)
not moving
b)
constant speed
c)
accelerating
d)
decelerating
55.

What is happening in this graph from point B to C?
a)
The object is going down a hill.
b)
The object is returning to its starting location.
c)
The object is slowing down.
d)
The object is staying still.
56.

Which part of the line shows the constant speed?
a)
C to D
b)
all of above
c)
E to F
d)
A to B
100 %

