
 Worksheets
Scatterplot Correlation
Total questions: 25
Worksheet time: 42mins
Name
Class
Date
1.

What is the type of association?
a)
Negative
b)
no association
c)
positive
2.

What type of association does this graph have?
a)
positive
b)
negative
c)
none
d)
all of the above
3.
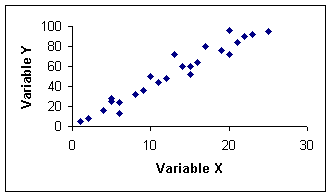
What type of association does this graph have?
a)
positive
b)
negative
c)
none
d)
all of the above
4.

What type of association does this graph show?
a)
Positive
b)
negative
c)
none
d)
all of the above
5.

What type of association does this scatter plot show?
a)
positive linear association
b)
negative linear association
c)
no association
d)
nonlinear association
6.
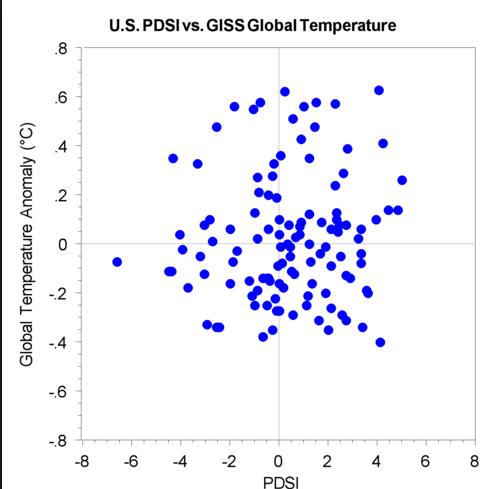
What type of association does this scatter plot represent?
a)
positive linear association
b)
negative linear association
c)
no association
d)
nonlinear association
7.

What type of association does this scatter plot represent?
a)
positive linear association
b)
negative linear association
c)
no association
d)
nonlinear association
8.

The following scatter plot shows Pam's training as she prepares to run a 6 mile race at the end of the month. Which of the following would be a reasonable approximation for the length of time it would take for her to run 6 miles?
a)
A. 50 min
b)
B. 80 min
c)
C. 45 min
d)
D. 60 min
9.

The scatter plot shows the relationship between the number of chapters and the total number of pages for several books. Use the trend line to predict how many chapters would be in a book with 180 pages.
a)
12 chapters
b)
15 chapters
c)
18 chapters
d)
21 chapters
10.
You are analyzing a scatter plot that has a negative correlation. What is true of the of the x and y values?
a)
As x increases, y decreases
b)
As x increases, y increases
c)
As x decreases, y decreases
11.

About how many male math teachers were there in 2006?
a)
15
b)
30
c)
35
d)
45
12.

Which scatter plot shows a linear relationship between x and y?
a)
Graph A
b)
Graph B
c)
Graph C
d)
Graph D
13.

Mrs. Collins made a scatterplot to show the relationship between the number of absences and a student’s final exam score. Based on this scatterplot, a student with 6 absences should get approximately what score on the final exam?
a)
65
b)
92
c)
70
d)
76
14.

Describe the correlation in the graph shown.
a)
Strong Negative
b)
Strong Positive
c)
Weak Negative
d)
Weak Positive
15.

Describe the correlation in the graph shown.
a)
Strong Negative
b)
Strong Positive
c)
Weak Negative
d)
Weak Positive
16.

Describe the correlation in the graph shown.
a)
Strong Negative
b)
Strong Positive
c)
Weak Negative
d)
Weak Positive
17.

Describe the correlation in the graph shown.
a)
Weak Negative
b)
Weak Positive
c)
Strong Negative
d)
Strong Positive
18.

Describe the correlation in the graph shown.
a)
Strong Negative
b)
Strong Positive
c)
Weak Negative
d)
No Correlation
19.

Estimate the correlation coefficient.
a)
r=-1
b)
r=-0.5
c)
r=1
d)
r=0.5
20.

Estimate the correlation coefficient.
a)
r=-1
b)
r=-0.5
c)
r=0.5
d)
r=1
21.

Describe the relationship between the variables.
a)
no correlation
b)
strong positive correlation
c)
strong negative correlation
d)
weak positive correlation
22.

Estimate the correlation coefficient
a)
r=-1
b)
r=1
c)
r=-0.5
d)
r=0.5
23.

Estimate the correlation coefficient.
a)
r=1
b)
r=-1
c)
r=0.5
d)
r=-0.5
24.

Estimate the correlation coefficient.
a)
r=0
b)
r=-1
c)
r=1
d)
r=2
25.

Estimate the correlation coefficient.
a)
r=-1
b)
r=1
c)
r=-0.5
d)
r=0.5
100 %

